Moving Charts: STEEM Prices Analysis | 10% To @tron-fan-club
Hello and good evening to everyone at the Tron fan club. Last week had a bit of both, ups and downs. The market was more volatile than ever. Steem was no exception to it.

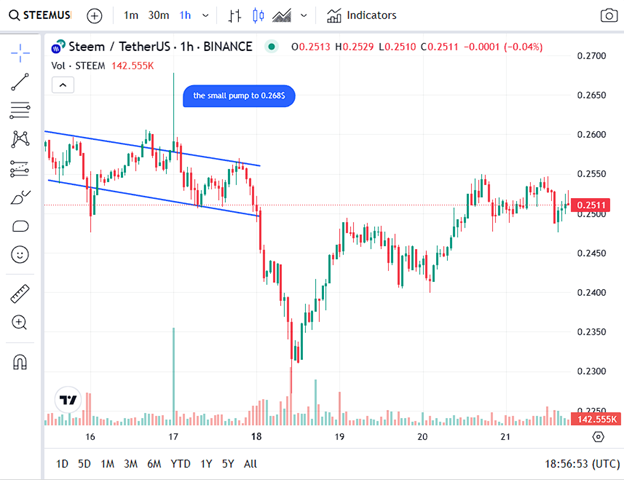
Last week we saw steem take a dive from its 0.26$+ valuation to the ballpark of 0.24$. It has bounced back since then. As we can see steem was trading at 0.259$ per token, a week ago. Apart from the one sharp spike where steem visited the 0.268$ area, it has largely been on the negative for the first 3 days of our count.
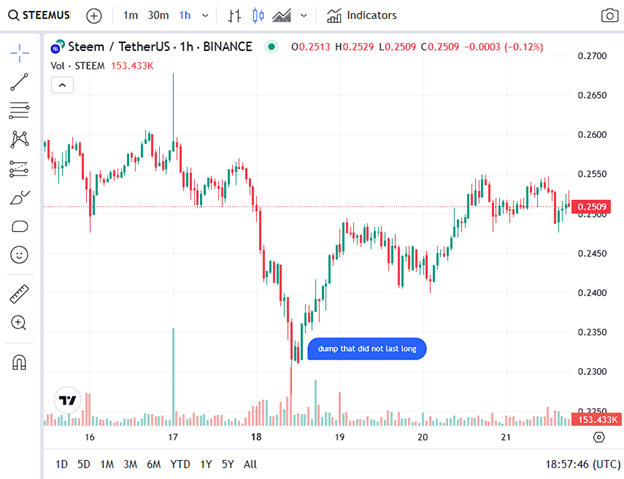
Then late into 17th December, the dump worsened. Taking steem all the way down to 0.227$. That is a significant fall from where it was. Luckily this situation didn't last long and we got back to a respectable 0.24$ margin, finally upwards of the 0.24$ support range.
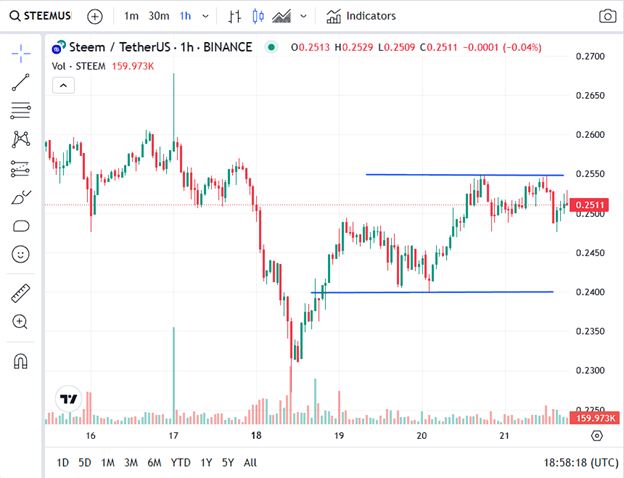
After being bounced at the support area for about three times, steem finally shows some positive. As we can see, in the last two days, following the market-wide pump in cryptocurrencies, steem too has gained some value, currently bumping into the 0.255$ area. It is traded at 0.251$ per token at the moment.
All Screenshots are taken from Coingecko
Steem has been going through a bit of a rough patch lately. After being consistently on the high for the past few weeks, we have witnessed a downturn in valuation over the last couple of days. Given how the market has been for the altcoins, expect stiff resistance even when the leading tokens take a turn for the better.
No word from this article should be taken as financial advice.
Thank You.
VOTE @bangla.witness as witness

OR

You have made a well detailed analysis. Thank you for sharing
Nice analysis about steem price with chart. Thanks for sharing
Great work, well detailed thanks for sharing