Moving Charts: TRX Value Per Coin Analysis | 10% To @tron-fan-club
Hello and welcome to everyone at the Tron fan club. Today we take a look at TRX and its price movements. Very recently the market has been relatively stable and is actually gaining some pace. Trx has been following the mass trend and the result is reflected in the chart. And as usual, we start from a week ago.

Made with Canva.
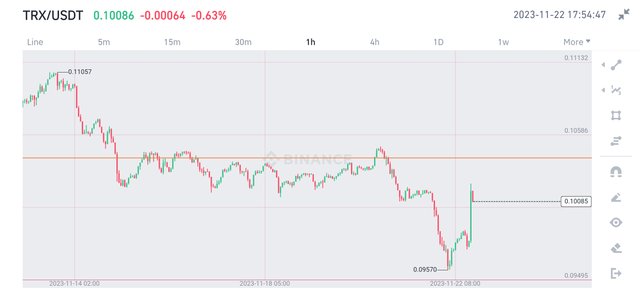
For the last few weeks, TRX has been performing very well. However, this was not a week in favor of TRX. The week started with TRX losing the support level of 0.104$. However, TRX continuesly tried to regain the level for several days. It fluctuated around 0.1$ for a while.
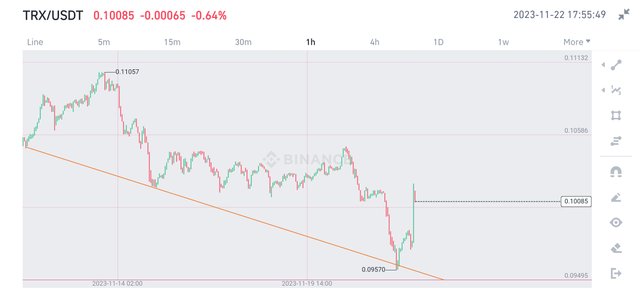
After the fifth try to break the new resistance, TRX started to lose strength. The continuous rejection made it weak. So, it started going downwards. There was this trendline (shown above) that acted as a support for TRX. It bounced from there.
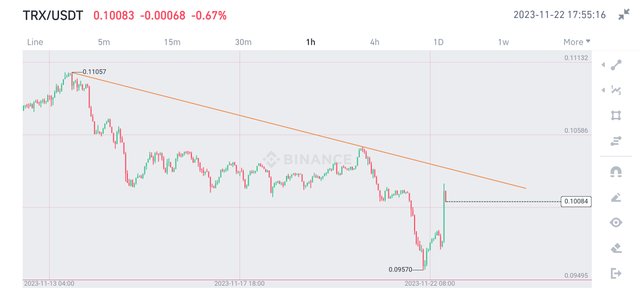
TRX is down 3.4% in a week, which is not that bad. TRX is, mayba, just consolidating. Correction is always good as it helps gathering strength. So, TRX needs to slowly break the resistance zone of 0.104$.
All Screenshots are taken from Binance
My prediction is that we break the resistance level after a little bit of consolidating. But it is important that TRX confirm the break-out with a successful retest. On the other hand, losing the support would be bad for TRX.
No words from this article should be taken as financial advice.
VOTE @bangla.witness as witness

OR

https://twitter.com/Arsalaan00070/status/1727297508433609153?t=tVeBAkkkXc4AuJG-eB2HuA&s=19