Moving Charts: TRX Value Per Coin Analysis | 10% To @tron-fan-club
Hello and welcome to everyone at the Tron fan club. Today we come back to TRX. This week has been volatile for the token in discussion. It has been relatively stable throughout the week but there was a pump in midweek. We now see a description of TRX price movements in the last seven days.

Made with Canva.
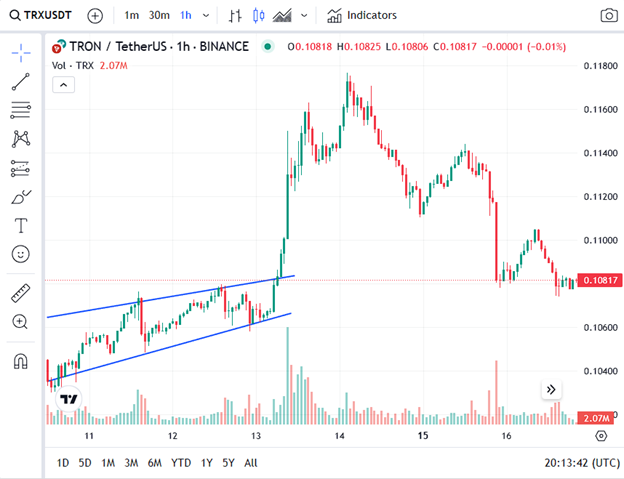
Trx was being traded at 0.104$ at the beginning of the week. From there we can see a small uptick in prices of TRX, taking the token to 0.108$ which looks to be a resistance at this point. There seem to be two attempts at breaking through this barrier. But as they say, the third time is a charm.
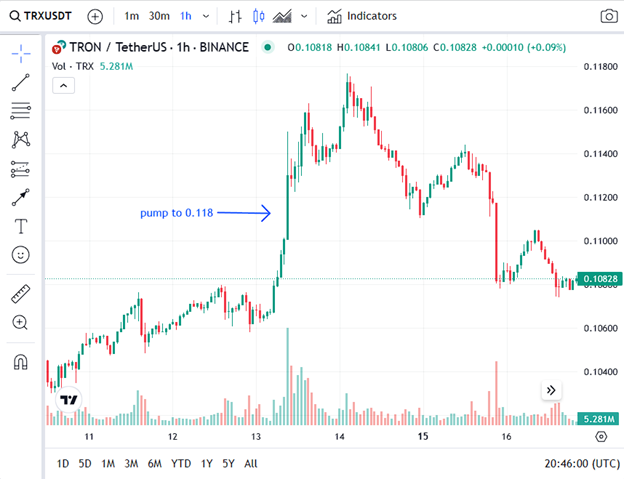
Then on 13th December when TRX tried to break through for the 3rd time, it clicked. And over the span of a day, it went almost up to 0.118$. A weekly high of 0.1176$. But since there was a pump, a reversal is also in order.
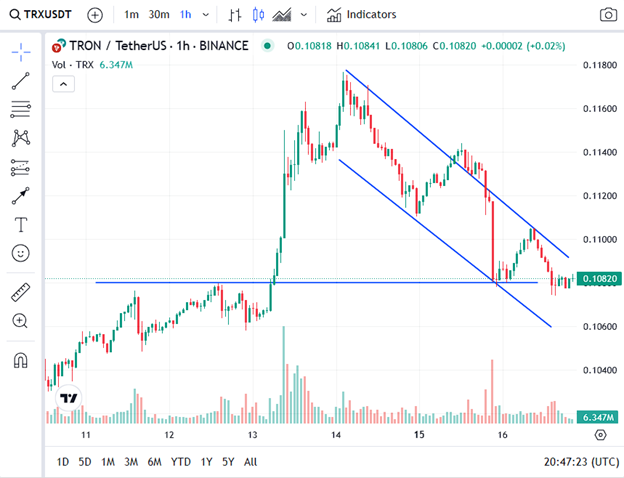
The reversal to this pump was slower than the uptrend itself. And it stopped multiple times, trying to stay afloat at different support margins, which eventually didn't help much. We can see that TRX had highs of 0.114$ and 0.111$. Before coming back to where it was before the pump. TRX has bounced off the 0.108$ margin twice. Which makes it a relatively stable support barrier. TRX currently trades at 0.11828$. And maybe we can expect some stability or upward movement from here on.
All Screenshots are taken from Coingecko
No words from this article should be taken as financial advice.
VOTE @bangla.witness as witness

OR

https://twitter.com/Arsalaan00070/status/1747368289196703992
Nice analysis on the price chart of tron, evidently this will be a good year for cryptocurrencies