Moving Charts: BTC Value Per Coin Analysis | 10% To @tron-fan-club
Hello everyone and welcome to everyone at Tron Fan Club. To our delight, the market has seen some positive signs over the past few weeks. Throughout the market, there have been uptrends. But a correction and some consolidation became inevitable. And it is no different for BTC as well. So, we saw BTC fluctuate a lot under the strong resistance zone. Today we will look at the price movements of BTC and reflect on where it could go next.

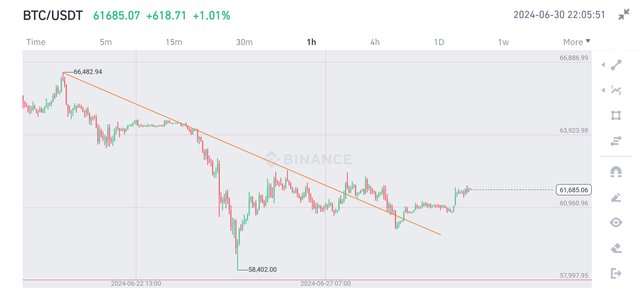
Last week, the King of Cryptocurrencies, BTC was hovering around 64000$ level. BTC was on downtrend for weeks. This move continued in this week also. In this weeks, BTC fluctuated a lot above the strong support zone of 60000$. At the started of the week, BTC had a break-through. Due to fall-out, BTC went down to the 58400$ level, which is clearly a strong support zone.
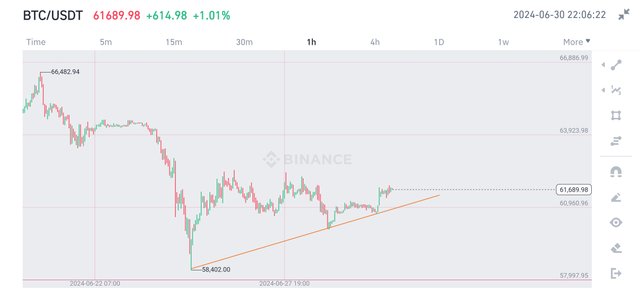
After the fall, BTC quickly bounced at the support level. After getting bounced at the 58400$ zone, BTC gained momentum and so started going up. Thus, it broke through the bearish trendline. Currently, it clear that BTC needs to hold onto the support level of 60000$ zone. It alsp needs to break 64000$. All this can happen if BTC holds onto the bullish trendline shown above. It is now at 61600$. This is ultimately a 3.9% lose in value over a time span of seven days.
All Screenshots are taken from Coingecko
No words from this article should be taken as financial advice.
Thank You for reading.
VOTE @bangla.witness as witness

OR

https://x.com/Arsalaan00070/status/1807447573063766110?t=3AqMwIU6LhWFkROjccYLLg&s=19
Great analysis on Bitcoin price hopefully we see much gains this month of July