Moving Charts: BTC Value Per Coin Analysis | 10% To @tron-fan-club
Hello everyone and welcome to everyone at Tron Fan Club. To our delight, the market has seen some positive signs over the past few days. Last week has been particularly good for most of the tokens. Throughout the market, there have been uptrends. And it is no different for BTC as well. There are some substantial gains on record. Today we will look at the price movements of BTC and reflect on where it could go next.

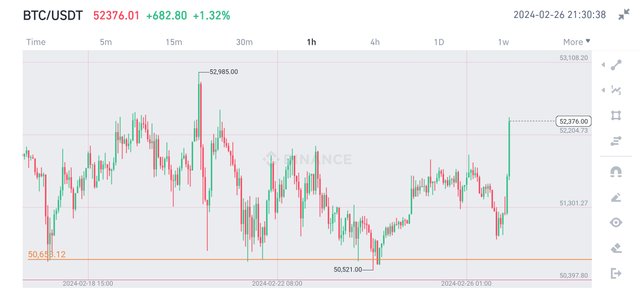
Last week, the King of Cryptocurrencies, BTC was hovering around 51000$ level. The week started as BTC fell into the support zone of 50600$. As it soon bounced from this level, we got the glimpse of how much strong support this level was going to be. After the bounce, BTC gradually went to the level of 53000$, where it got rejected badly. After that, it came down to the previously mentioned strong support zone.
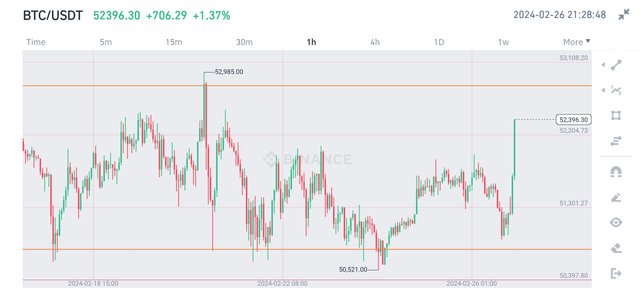
The support held again. BTC went up again and created a roller-coaster chart. Eventually, several bounce happened at the same level, creating tripple bottom, signaling bullish movement. Currently it is going upwards with a potentiality to break the resistance at 53000$ level. Ultimately this is still a 3% gain in 7 days and it's huge.
All Screenshots are taken from Coingecko
No words from this article should be taken as financial advice.
Thank You for reading.
VOTE @bangla.witness as witness

OR

wow very nice analyse, very nice! want more post on such important topic
https://twitter.com/Arsalaan00070/status/1762196523629301962?t=ZAY9rY1drhmhWjHEtMcciQ&s=19
Nice of you updating us on the price of bitcoin, that's a useful and valid analysis you have done, as a member of the community I appreciate
Good explained about Moving Charts: BTC Value Per Coin.I think you are a good writer. You keep giving us something good every day. Thank you. Good luck for you.