Moving Charts: STEEM Prices Analysis | 10% To @tron-fan-club
Hello and good evening to everyone at the Tron fan club. Another week has been passed so quickly. However, it was different than any other week. The market was more volatile than ever. Steem was no exception of it.

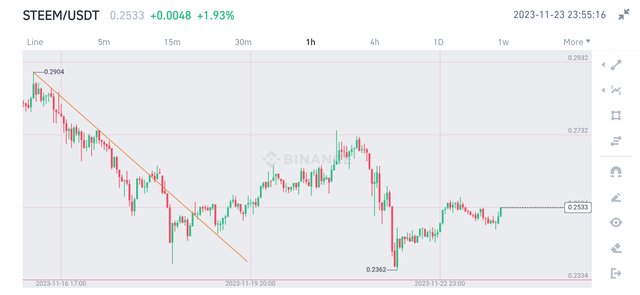
Steem was 0.274$ per coin just seven days earlier.
In the chart above, that bearish trendline is just an extension of the line that we drawn last week. Steem continued to follow that line from the start of the week. After the the quick fall to 0.237$, Steem quickly bounced back.
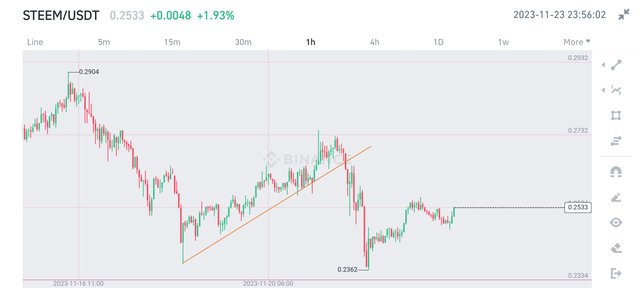
After the bounce, Steem gradually rise towards the resistance level, and broke it. Steem seemingly made a bullish trendline, which it eventually lost. This time the fall was sharper than the previous one.
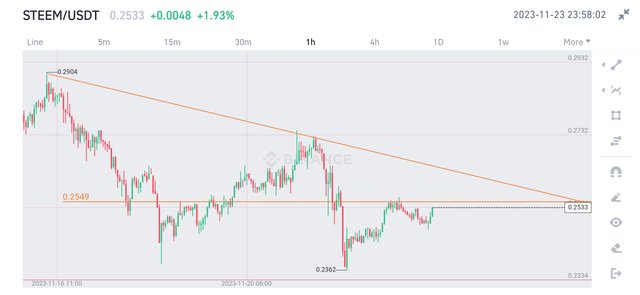
Clearly, the support zone at 0.237$ is very much strong. As a result, it bounced at the support again and got back. Now, there is a new bearish line formed. To get upwards, Steem needs to break the 0.255$ line and eventually break the bearish trendline, whereas losing 0.236$ would be painful. After all the drama, Steem is down 8% in the weeky chart.
All Screenshots are taken from Binance
With the positive vibe spreading again throughout the crypto market, a lot of coins are currently rising. But correction is very much needed. Steem is no exception. However, I believe we will fluctuate in the 0.235$-0.275$ range for a while.
No word from this article should be taken as financial advice.
Thank You.
VOTE @bangla.witness as witness

OR

https://twitter.com/Arsalaan00070/status/1727752337677291671?t=iFM-8kheOSY_eAMqLs_92Q&s=19
Great analysis you have done here on the price trajectory of steem
Thank you for your engagement. Have a good day