Moving Charts: BTC Value Per Coin Analysis | 10% To @tron-fan-club
Hello everyone and welcome to everyone at Tron Fan Club. With the recent movements from Bitcoin, it has puzzled everyone. The volatility was at peak last week. Let's take a look at the King of Cryptocurrencies, Bitcoin's performance in the last seven days.


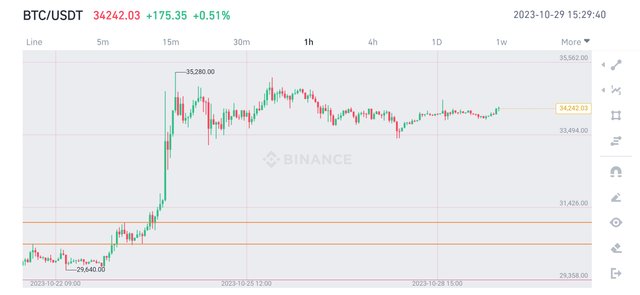
With a slow start, the week soon turned out to be full of actions. We started by hovering just below the 30000$ region. As we analysed the chart previous week, BTC was on the verge of a make or break point. Luckily, BTC broke through the resistance level around 31000$.

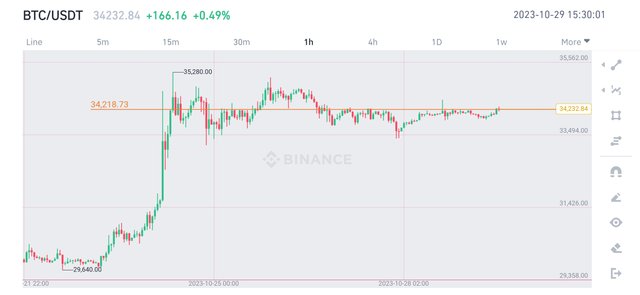
After a successful retest, BTC just skyrocketed. There was a big green candle touching the strong resistance of 35000$ zone. Then, BTC retraced back and started consolidating. BTC is still hovering around the 34200$ zone. After the sudden pump, it seems to be gathering strength to make another big movement.

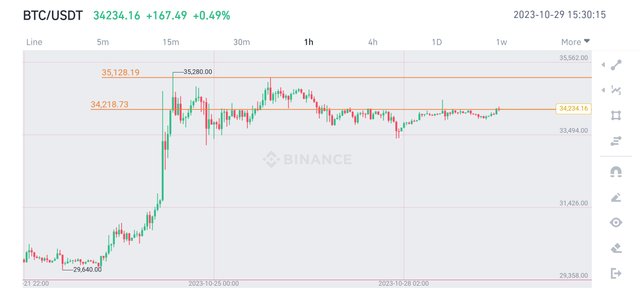
The resistance level, that BTC broke through at the start of the week, was a historical one. BTC needs to hold onto the support of 34000$ and break the next resistance level of 35200$ with a successful retest. If BTC can break the resistance at 35200$, there will be endless possibilities ahead of it. BTC is up 14.2% over the last seven days, which is ultimately a great achievement.
All Screenshots are taken from Binance
Nobody knows what's coming next. We may fluctuate between the confirmed support level and resistance for a while, which are 33500$ and 35200$ respectively. The news from outside world may direct BTC to where it would go next.
Market is very volatile right now as it has always been. So, if you are investing or trading, be always cautious. No words from this article should be taken as financial advice.
Thank You for reading.
VOTE @bangla.witness as witness

OR

https://twitter.com/Arsalaan00070/status/1718583627372761491?t=mXxb4YQgzFcTMCYjttik5A&s=19
Nice analysis about BTC. Hopefully if Bitcoin can break the next resistance then we will see a nice upward move.