Moving Charts: STEEM Prices Analysis | 10% To @tron-fan-club
Hello and good evening to everyone at the Tron fan club. The market has rather on a fall for the past few weeks. We have seen most tokens lose valuation. Steem can be seen as one of them. Today we will see steem price movements and reflect on how it has fared.

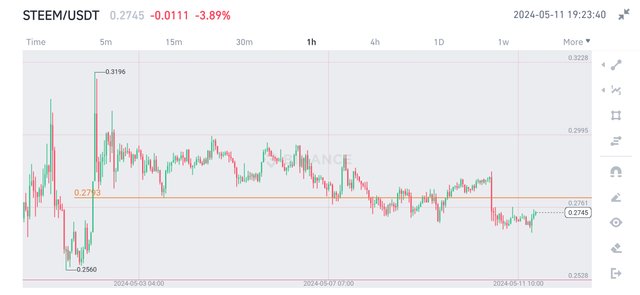
The week started with Steem rising through the resistance (0.279$) shown above. Steem broke through the level but it was actually a fake-out. So it started going down and came to the same level that it broke through.

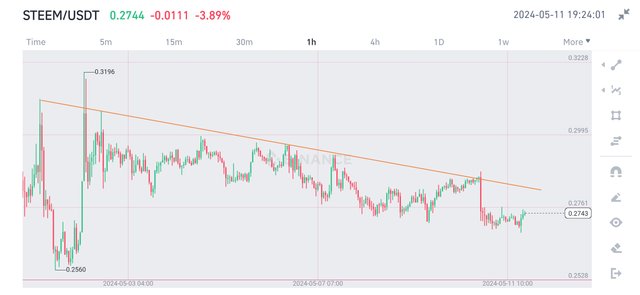
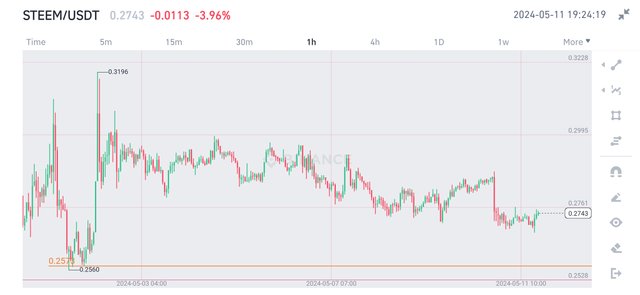
Actually, Steem was following a bearish trendline also. It is still being followed. Steem got stuck below this trendline and went down with it. Steem bounced several times at the support level of 0.279$ and after the mid-week, Steem lost the support.

Steem created a bearish trend over a span of seven days. After getting rejected badly at the 0.32$, Steem started coming down quickly. Steem is still following the trends. As there seemed to be a strong resistance zone at 0.279$, Steem needs to break through this zone again with a successful retest.
All Screenshots are taken from Coingecko
After experiencing a few good weeks, Steem is currently showing bad performance. It is down 8.8% in a week, which is very unfortunate.
No word from this article should be taken as financial advice.
Thank You.
VOTE @bangla.witness as witness

OR


https://twitter.com/Arsalaan00070/status/1789296438746509501?s=19
Let's see how Steem performs before this week ends, I am so sure it will definitely have a massive break upward
STEEM Prices Analysis I learned something important from your post. I didn't have a good idea about it. Thank you for discussing something important.
It's good to know that you've found value in my post. Thank You!
You have provided a great analysis regarding moving charts. Keep it up