Moving Charts: TRX Value Per Coin Analysis | 10% To @tron-fan-club
Hello and welcome to everyone at the Tron fan club. Today we take a look at TRX and its price movements. Very recently the market has been relatively stable and is actually gaining some pace. Trx has been following the mass trend and the result is reflected in the chart. And as usual, we start from a week ago.

Made with Canva.
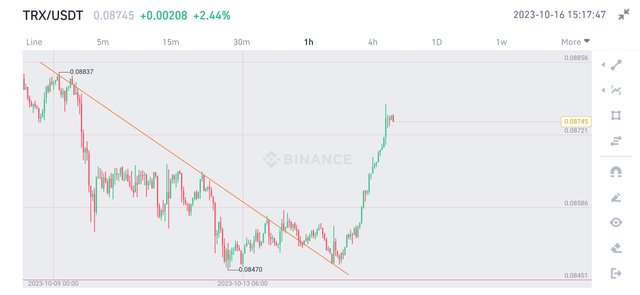
For the last few weeks, TRX has been performing very well. There was some pullback last week which continued in this week also. The week started with TRX falling sharply to the support level of 0.0855$. From that level, TRX bounced and hovered above that level for a while.
The weeks long bearish trendline, which was leading TRX to the downside, was very much strong. In the middle of the week, TRX failed to break this trendline and so fell through the support level mentioned earlier.
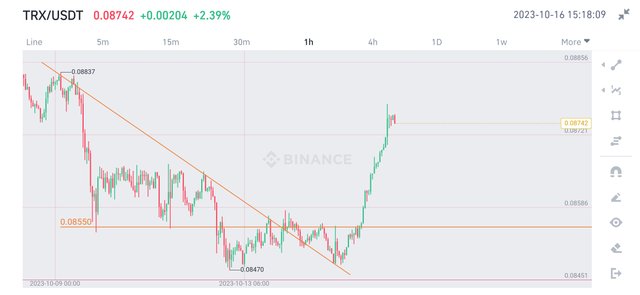
Soon after losing support, TRX broke through the trendline and hovered below the new resistance level. It also broke that level soon enough. After that, TRX pumped continuously. Currently it seems like TRX is going to make an attempt to break the resistance level at 0.0883$.
All Screenshots are taken from Binance
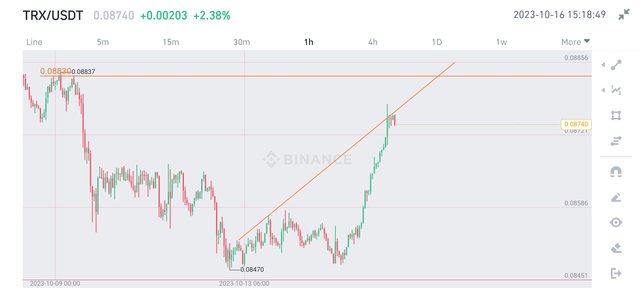
My prediction is that we break the resistance level very soon. But it is important that TRX confirm the break-out with a successful retest. On the other hand, losing the support would be bad for TRX.
No words from this article should be taken as financial advice.
VOTE @bangla.witness as witness

OR

https://twitter.com/Arsalaan00070/status/1713849632814698830?t=jVuz0f_0MD1aOHEqvA1KQg&s=19
Great detailed analysis on trx, always appreciate good T.A
This is a nice trx value per coin analysis that you have drawn, thanks for sharing with us 😊👍
Tried my best analysis possible outcomes. You are always welcome!
It is great to see, keep it up brother
Great post analysis on trx.