Moving Charts: TRX Value Per Coin Analysis | 10% To @tron-fan-club
Hello and welcome to everyone at the Tron fan club. TRX has been performing great in the last few months. This was another eventful week for TRX. We have seen the token lose a substantial amount of value. Today we look back at the price movements of TRX over the last few days.

Made with Canva.
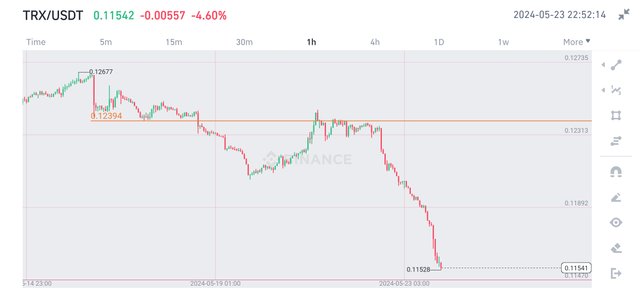
TRX enjoyed a powerful uptrend from AUG'23 to FEB'24. In this time, TRX's price literally doubled. Although other cryptocurrencies faced a lot of hiccups in the road, TRX was pretty much stable in its growth until the last two months. This last two month is becoming an exception, as TRX lost value this time. The week started with TRX losing the support zone of 0.124$.
TRX started going downwards at the beginning of the week. It was just under 0.126$ only seven days ago. After losing the support, it started falling very quickly. But in the middle of the week, it attempted for a reversal move, but failed. Actually TRX lost the bullish trend soon enough and started coming down again.
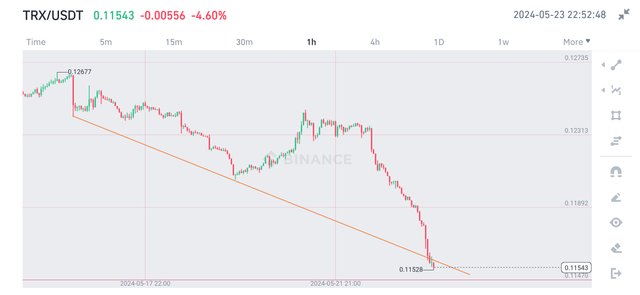
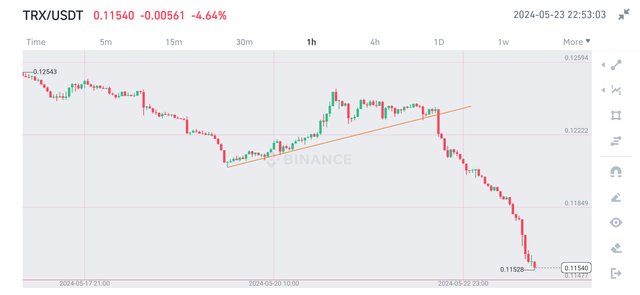
TRX is down 8.3% in a span of seven days. This happened because after getting rejected at the resistance, it quickly fell. Thus TRX created a descending support line. Following the days long trendline, TRX kept its down movement. Now, TRX is hovering around 0.115$.
All Screenshots are taken from Coingecko
No words from this article should be taken as financial advice.
VOTE @bangla.witness as witness

OR

https://twitter.com/Arsalaan00070/status/1793691531733532798?t=yu1VVDOZDq_8GIGwn6YtNA&s=19
Brother has presented an excellent post on moving chart of trx. I am very sad to see that it has been down since 7 days.