Moving Charts: STEEM Prices Analysis | 10% To @tron-fan-club
Hello and good evening to everyone at the Tron fan club. Another week has been passed so quickly. However, it was different than any other week. The market was more volatile than ever. Steem was no exception of it.


Steem was 0.173$ per coin just seven days earlier. The week started with it gradually rising towards the crucial resistance level of 19 cent. Steem broke through this level successfully with a retest. After that, Steem hovered between the range of 0.20$ to 0.22$ for a while.
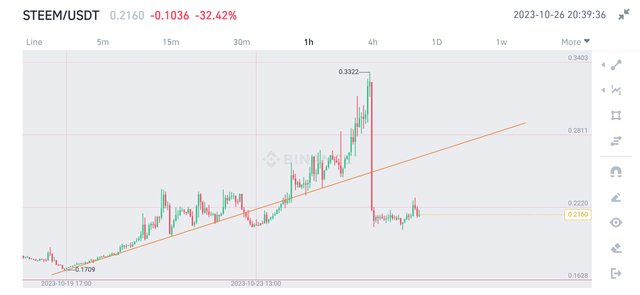
The new support level at 0.19$ became very much strong. So, after a while, Steem started to rise. From the start of the week, a bullish trendline was being formed (shown above). This played significantly for Steem's movement. Steem, with continuous rise, reached 0.33$ within two days.
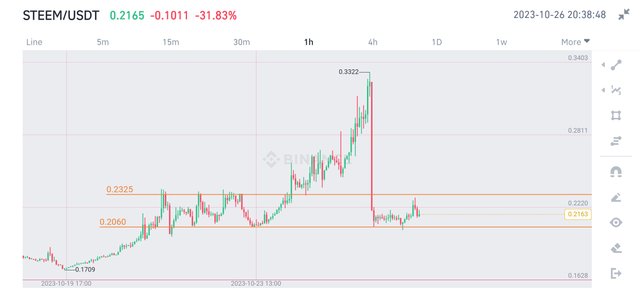
Steem surprised everyone, again, by losing the trendline and coming back to amost where it was two days ago. There is now two confirmed zones which are directing the price of Steem. To get upwards, Steem needs to break 0.232$ level, whereas losing 0.206$ would be painful. With all the drama, Steem is still up 25.6% in the weeky chart.
All Screenshots are taken from Binance
With the positive vibe spreading again throughout the crypto market, a lot of coins are currently rising. Steem is no exception. However, I believe we will fluctuate in the 0.20$-0.23$ range for a while.
No word from this article should be taken as financial advice.
Thank You.
VOTE @bangla.witness as witness

OR

https://twitter.com/Arsalaan00070/status/1717555436382273779?t=Jw-7bRLnZhcED-2mr6K6vQ&s=19
Great analysis on the price of steem, ofcourse I know there will be much retracement after this rally
Very nice analysis of steem price from weekly chart and hope it will rise again soon.