Moving Charts: TRX Value Per Coin Analysis | 10% To @tron-fan-club
Hello and welcome to everyone at the Tron fan club. TRX has been performing great in the last few months. This was another eventful week for TRX. We have seen the token gain a substantial amount of value. Today we look back at the price movements of TRX over the last few days.

Made with Canva.
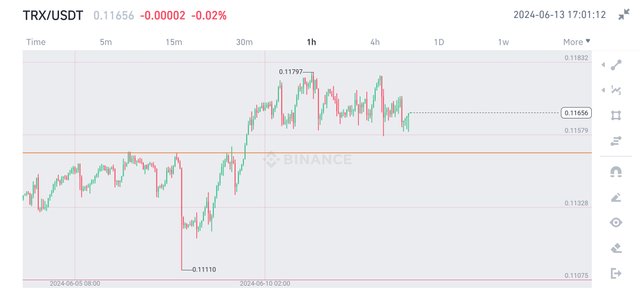
TRX enjoyed a powerful uptrend from AUG'23 to FEB'24. In this time, TRX's price literally doubled. Although other cryptocurrencies faced a lot of hiccups in the road, TRX was pretty much stable in its growth until the last three months. This last three month is becoming an exception, as TRX lost value this time. The week started with TRX breaking through the resistance zone of 0.115$.
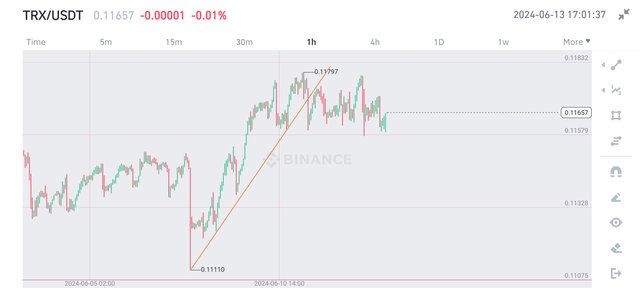
After fluctuating a lot at the beginning of the week, TRX started going upwards. It was just under 0.114$ only seven days ago. After breaking through the resistance, it started going up very quickly. But in the middle of the week, it got rejected at 0.118$.
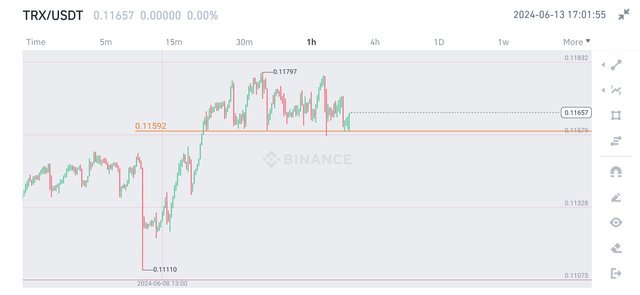
TRX is up 1.15% in a span of seven days. This happened because after getting rejected at the resistance, it quickly fell and lost the bullish trend. But it is still above the support level of 0.116$. So, it needs to hold onto this support and break-though the 0.118$ resistance. Now, TRX is hovering around 0.1165$.
All Screenshots are taken from Coingecko
No words from this article should be taken as financial advice.
VOTE @bangla.witness as witness

OR

I am not expert in technical analysis but it's good to see this type of thoroughly discussed TA. Thanks for sharing