Moving Charts: BTC Value Per Coin Analysis | 10% To @tron-fan-club
Hello everyone and welcome to everyone at Tron Fan Club. After creating a new all-time high in March 2024, Bitcoin has been consolidating for a long time. Hence, we witnessed downtrend in the last months with some exceptions. This week, we saw BTC fluctuate a lot above the strong support zone. Today we will look at the price movements of BTC and reflect on where it could go next.

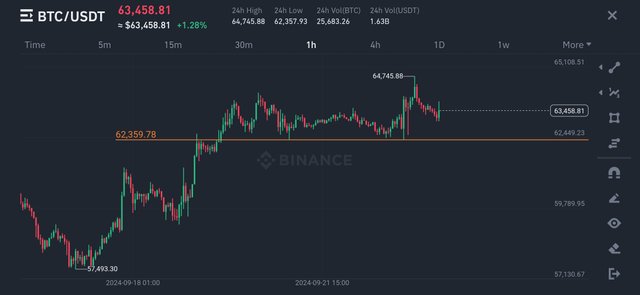
Last week, the King of Cryptocurrencies, BTC was hovering around 57300$ level. BTC was on downtrend for weeks. We saw a reversal this week. In this weeks, BTC started going up from the first day. At the start of the week, BTC broke through the resistance level of 62400$. Due to break-out, BTC went up to the sub 65k$ level, which is clearly a strong resistance zone.
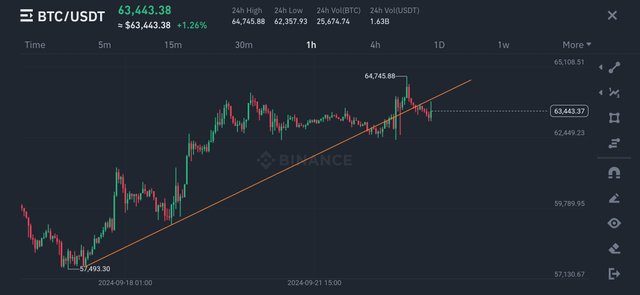
After the quick upward movement, BTC got rejected at the resistance level. So, BTC started falling quickly. So, It lost the bullish trendline shown above. Currently, it clear that BTC needs to get on that line. It also needs to break through the resistance ahead. It is now at 63340$. This is ultimately a 10% gain in value over a time span of seven days.
All Screenshots are taken from Coingecko
No words from this article should be taken as financial advice.
Thank You for reading.
VOTE @bangla.witness as witness

OR

https://x.com/Arsalaan00070/status/1838232606195974509?t=Fj1WhUjrPzufLhynA9T00g&s=19
It is a great post of Moving Charts: BTC Value Per Coin Analysis.
It's a good technical analysis for the Bitcoin and I hope it follows the same as you have discussed in the post so let's see how things go forward.