Bitcoin bounces at 1-month lows — Watch these BTC price levels next!
Bitcoin bounces at 1-month lows — Watch these BTC price levels next!

Bitcoin has fallen to one-month lows, and traders are ready with their BTC price targets — which will come true?
The aggregate cost price of various hodlers is now coming into play as fears rise of a return below $60,000.
BTC price bottom levels track hodlers’ cost basis
Bitcoin
BTC
tickers down
$66,124
surprised on June 14 by delivering another 3.5% dip, taking BTC/USD to $64,950 on Bitstamp.
Building on existing weakness, the move took current week-to-date losses to more than 6.7% — and BTC price action to its lowest levels since mid-May, data from Cointelegraph Markets Pro and TradingView confirms.
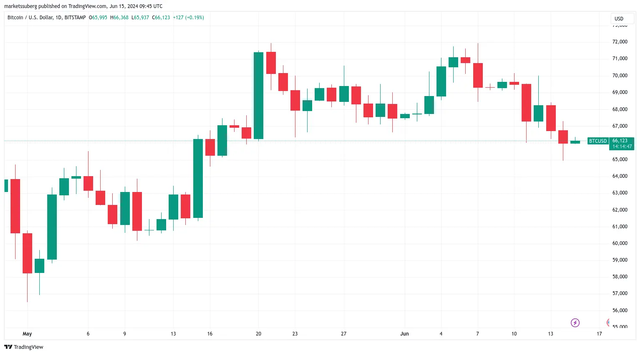
BTC/USD 1-day chart. Source: TradingView
“Bitcoin just lost technical support at the 50-Day Moving Average,” Keith Alan, co-founder of trading resource Material Indicators, wrote in part of market coverage on X.
BTC/USD chart
While $65,000 managed to hold, others are looking for possible areas to call a near-term BTC price floor while new all-time highs look increasingly out of reach.