Can you create a fortune by reading a crypto chart?
Some people read the tea leaves in a tea cup to tell your fortune and other can read bar charts and pattern to tell you how to make a fortune.
So what is the difference ?
Well it is both an art an a science. The art of reading tea leaves makes you drink a cup of tea. When the leaves settle down they form a pattern.
The tea leaf reader interprets these patterns and is able to tell you things of the past, important events of your life and sometimes even your future.
When it comes to reading charts or patterns of a commodity, stocks, forex or crypto prices it is a detailed science.
This is not a subject that can be covered in a few posts.
Instead my attempt is to try to give you some glimpses into the subject so that the next time you look at a chart displaying crypto prices you are better informed about the information that the chart in front of you holds.
The line chart
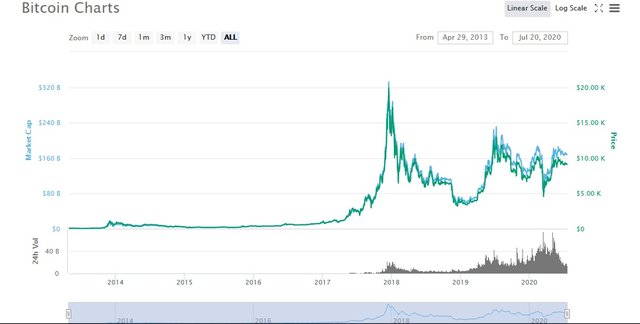
durUsually the price of a crypto is listed as a line that represents its price incrementally over time.
From this information one can find the general idea of how the price is moving.
The Candle stick chart holds a lot more information.
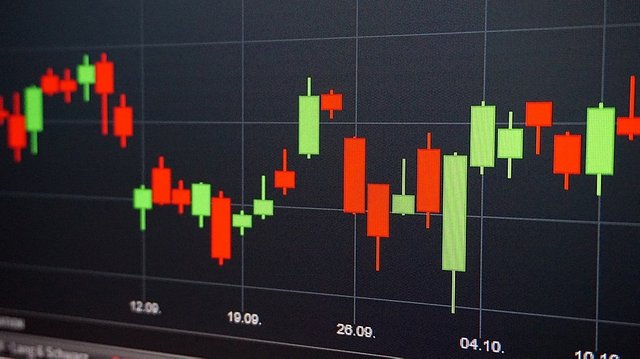
Look at a candle stick chart and you would be amazed at the amount of information it holds.
To understand and use a candle stick chart one has to understand its components.
A candlestick chart is made up candles of two different types of color.
Usually one is green and the other is red.
A Green candle stick depicts a bullish or increasing price.
A Red candle stick represents a bearish or decreasing price.
What does a candle stick tell?
A candlestick tells 4 distinct pieces of information about the crypto that is...
- Open Price :The opening price of the crypto being charted.
- High Price : The High price of the crypto achieved in the given interval for which the candle stick is being drawn.
- Low Price : The low price is the lowest price of the crypto in the chosen time interval.
- Closing Price: This is the price at which the price closed in that time interval.
The time interval
This can be 1 min, 5 min ,30 minute. 1 hour, 1 day etc
It basically means the duration of time over which the price movement of the candle is considered.
So for a 5 minute candlestick the information displayed would pertain to that 5 minute duration.
be the opening price in that 5 time interval,
The high price in that 5 min duration
The Low price in that 5 min duration and
The closing price in that 5 min duration.
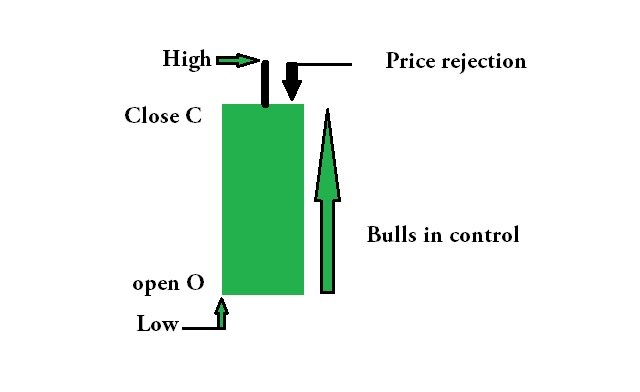
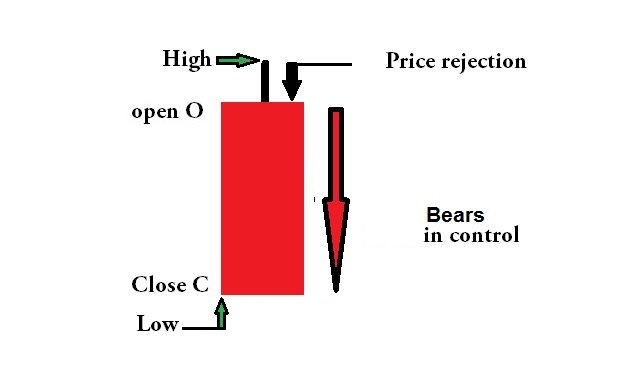
The body and Wick
A candle has 2 main components The body and the wick or the shadow.
The body of the candle represents the opening and the closing data.
A bullish Candle
A bearish Candle
If the opening price is lower than the closing price it is a bullish candle and represents a price rise over the given period of time.
If the closing prices is lower than the opening price in that time period than it means a fall in price over that time period and it means a bearish price pattern.
The body tells you who is in control. A green candle means the bulls are in control and price shows a rising trend and it is the reverse with a red candle.
The wick represents the highest and the lowest price points.
- Always observe : The size of body to wick
The size of body to wick displays useful information. If the wick is much higher as compared to the body it means a sign of price
rejection.
Though a green color is chosen to represent a bullish or increasing price pattern and a red color represents a falling or a bearish pattern one can chose any other distinct color combinations to represent the candlesticks.
Using the trading tools to represent candle sticks
Candle sticks provide useful price information however one need not draw them manually.
Most trading platforms provide this price movement in the candle stick pattern.
You can use tradingview to study charts and find information.
Does a green candle means I should buy and a red that I should sell?
A green candle does represent a bullish trend in a period of time that has elapsed it does not mean a continuation of trend.
So it does not mean the price would go on increasing in the future.
The same is the case with a red candle. It means bearish pattern but it does not say a bearish pattern would continue in the future.
For us to predict the future pattern we need to understand a lot more about candlesticks , its patterns, trends etc.
The idea of this post is to give you bite size information you can read and understand so that we can build on it in subsequent posts and be better informed about our crypto decisions.
Just as your reading a book "How to fly an Aeroplane" does not make you a pilot so please do not use this post as a DIY guide to investing in the crypto world.
Trading requires a lot of understanding and consider this as only a small step in that direction.
We sure would build on it over time.
Disclaimer : This post is not financial advice. Do your own research and due diligence before making an investment.
If you are interested in earning some extra income
Easy free Crypto money site method even grandma can do
Or wanna try your luck?
Win a lambo Get free crypto or More?
- As a long term supporter of project hope I am sharing 25% of the earning of this
post with @ph-fund that helps sustain the community economy

This information just barely scratches the surface. Trading is a complicated venture that can make you broke faster than it can make you wealthy. However, knowledge in reading the candle sticks is key to approaching success.
Yes I have tried to stick to the basics so that I may build on it one post at a time.
Appreciate your stopping by and leaving your valuable comment.
@tipu curate
Upvoted 👌 (Mana: 8/20) Trade Steem <-> BTC from your wallet :)
Very concise and clearly explained. Much appreciated.
Thanks @nzfxtrader I am glad my post could provide some value to you.
Appreciate your stopping by and commenting.
Thanks :)