TECHNICAL ANALYSIS, USING THE RANDOM INDEX OF CRYPTOCURRENCIES
Author: @madridbg, through Power Point 2010, using public domain images. Mediamodifier
Greetings and welcome dear readers of this prestigious platform, the topic that concerns us this time is oriented to the conceptual and practical approach of the cryptocurrency market through the random index indicator.
In this sense, it is important to establish a clear definition of what is the KDJ random index? It responds on the basis of oscillatory-type technical indicators, which is based on the stochastic parameters to follow the price action, hence its use is determined in the identification of the trend, as well as the reversals that occur on the price of an asset.
Understanding these scenarios allows timely speculation according to price action, where we can establish profitable market entries or exits. At the chart level, the indicator is made up of three fundamental lines that we will identify with the acronyms (K, D, J) and it is the interactions between these lines that allow us to extract relevant information about the behavior of an asset over time periods. determined.

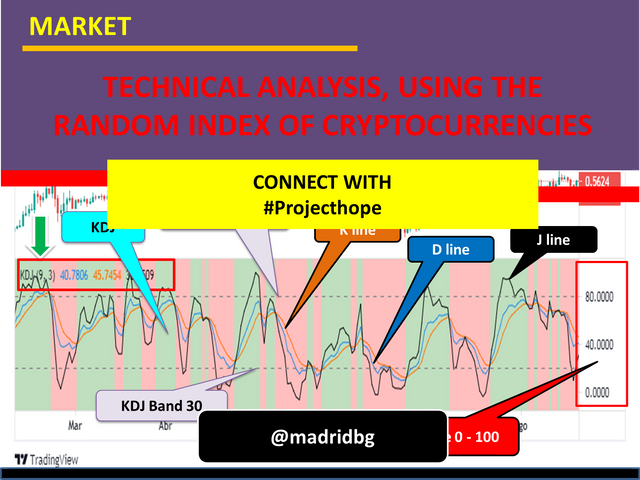
Screenshot taken by @madridbg through the tradingview portal. tradingview
Partiendo de lo expuesto anteriormente y del gráfico presentado, es necesario comprender los siguientes aspectos:
1. The upper and lower band on which the indicator is based allows us to establish when an asset is in overbought or oversold levels, in this way, we can configure these bands at critical levels that respond to 80% for the upper band and 20% for the lower one, in such a way that we can carry out the most precise speculations based on the behavior of the asset on these bands.
2. To predict the market trend, it is necessary to focus on the (J) line of the indicator, knowing that when it moves above the K and D lines, the market considered bullish and speculation is carried out in this same direction, in the opposite direction, when line (J) moves below line K and D we are in the presence of a bearish market that we can speculate in the same direction of the analysis.

Screenshot taken by @madridbg through the tradingview portal. tradingview
As we can see in the previous graph, we have identified some scenarios, where the previously established criteria are fully met based on the movements of the J line, which is the variant of the graph and makes it different from the behavior of the stochastic.
Starting from the previous approach, it is necessary to value and respond to an approach that any trader should make and that responds to how reliable the random index indicator is or can be. Personally, I consider it clear that no method of speculation is 100% reliable since they have their advantages and disadvantages, which is why I can establish that no indicator guarantees effectiveness when entering the market and less so with such high volatility. that is handled in the world of cryptocurrencies.
Hence, the fundamental thing is to have knowledge about the speculation methods and set up a winning strategy made up of several indicators, test their interaction and evaluate their performance based on the amounts of positive operation or those of us who lost it. In such a way and according to the sources reviewed, a winning strategy is one in which we can be victorious in 6 out of 10 operations, since if this behavior is constant in the end our investments will be positive.

BIBLIOGRAPHICAL REFERENCES CONSULTED
[1] How to find optimal entries with the KDJ indicator in IQ Option. Article: Online Access
OF INTEREST
•

Grateful with the community @project.hope and with all the management team of the same one that they motivate us to continue working in a mutual and balanced growth.


Hello friend @madridbg, there are many technical indicators that help to improve our ability to trade, this method that you show I did not know very well, today I knew a little more, now it is up to me to investigate about it to get a better knowledge of it, thanks for sharing this interesting information.