How to build a line chart using Echart.js and JavaScript
Charts are an important form of visual representation in the digital space and beyond.
People use charts for lots of purposes which fall under the umbrella of displaying statistics and historical data of any given body/entity.
Health practitioners would use charts to display the growth or decline rate of an outbreak/disease.
In the financial markets we use different kinds of charts to display data such as price, volume and technical indicators in the market.
Anyone can make use of a chart for any reason, in this post I'm going to share with you how you can generate charts in your application with JavaScript and display the chart for people to see.
In order to achieve our aim we are going to use a npm package known as Echarts which is a JavaScript based charting tool for applications to help generate our charts.
By the end of this post you must have at least a basic idea of how you can generate charts using JavaScript.
Using Echart package in a Javascript project
After you must have setup the server and get it running we need to add the echarts package to your html file by adding the following code in your HTML file
<script src="https://cdn.jsdelivr.net/npm/[email protected]/dist/echarts.min.js"></script>
We are now going to explore how we can build a chart using echarts.
There are six main types of chart offered by echarts, they include
I am going to demonstrate how to build only the line chart in this tutorial, you can check out the documentation to see the full list of possible functionalities offered by the library.
Line
In our HTML file we are going to add an element in the body tag that will serve as our container for the chart
<div class="myChart"></div>
Also, we would need to include jQuery in our HTML file, so add the following code in your HTML file
<script src="https://code.jquery.com/jquery-3.5.1.js"></script>
Then we will go on and add a <script> tag that will contain a JavaScript function for chart customization.
In the <script> tag, we will have the following code
<script  type="text/javascript">

    const  myChart = echarts.init(document.getElementById('myChart'))


    const  option = {
        xAxis: {
            type:  'category',
            data: ['Mon', 'Tue', 'Wed', 'Thu', 'Fri', 'Sat', 'Sun']
        },
        yAxis: {
            type:  'value'
        },
        series: [{
            data: [820, 932, 901, 934, 1290, 1330, 1320],
            type:  'line'
        }]
    };

    myChart.setOption(option);

</script>
Every chart component from Echarts can be initialized in three steps.
First, we have to initialize the element that will contain the chart.
We did that by adding this code
const myChart = echarts.init(document.getElementById('myChart'))
It uses the echarts.init() function to get the element with the specified id from the HTML markup and readies it for use.
Then we specify the options for the chart. The option variable is an object containing the characteristics and configurations for our line chart.
First we set the contents of the xAxis, which contains the days of the week
xAxis: {
    type:  'category',
    data: ['Mon', 'Tue', 'Wed', 'Thu', 'Fri', 'Sat', 'Sun']
}
Then we set the yAxis but we don't specify the value there, we only add the 'type' and set it to value.
Finally we add a series option containing the contents for the yAxis
series: [{
    data: [820, 932, 901, 934, 1290, 1330, 1320],
    type:  'line'
}]
If we save our HTML file and reload the page, we will have something like this
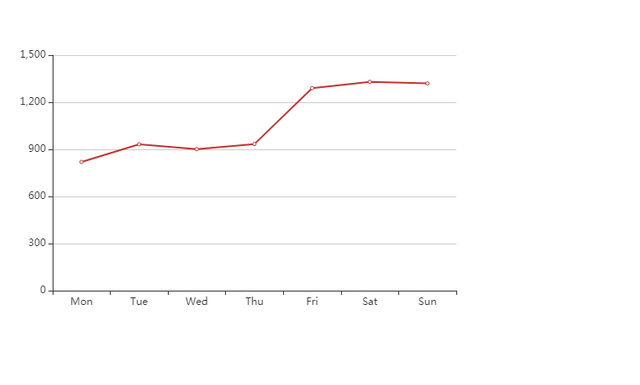
And like that we are able to create a line chart using JavaScript.
There are numerous ways in which you can customize your chart that we are not going to cover in this tutorial, in order to explore the full possibilities that comes with this library you would have to refer to the documentation which can be found here.
@tipu curate
Upvoted 👌 (Mana: 16/20) @swap.app - quick steem <-> sbd swaps
thanks a lot for your support !!!
(if you dont want these or consider it spam then please leave a reply to this comment instead of downvoting and i will follow up)
unless stated otherwise, you receive these because you voted on a @goldmanmorgan post
$trendotoken