BITCOIN ANALYSIS - THE CALM BEFORE THE STORM?
While prices are in a wait-and-see situation, Bitcoin's volatility is reaching the historical low. Does this herald a strong price movement for the year 2023? Analysis.
Bitcoin - Weekly chart
In the medium term, the situation remains unchanged from last week. The candles are small and Bitcoin is at a standstill. The weekly Tenkan remains the priority bullish target, set at $18,500.
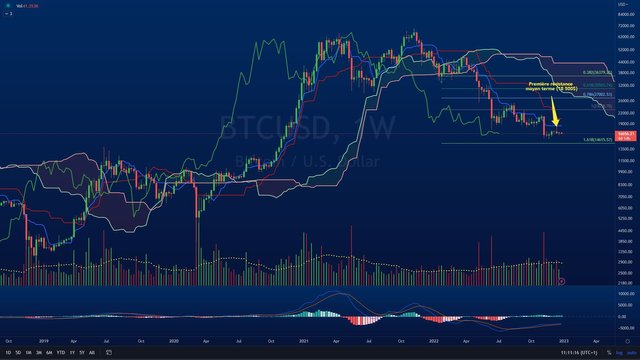
We will probably have to let the holidays pass and wait until the return of higher volumes to see a real continuation of the trend... Or simply a technical rebound. Only the market will decide what happens next.
The MACD indicator continues to diverge, which is worth noting and remembering for the future, as it shows the decline in strength of the sellers.
Bitcoin - Daily chart
On the daily chart, the situation is also stuck. With volume at a standstill and prices moving in a doji pattern.
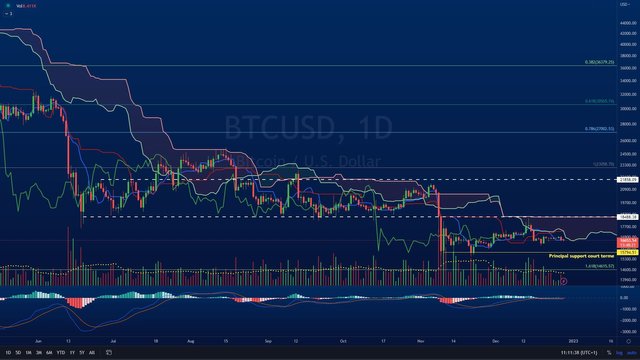
Today, the daily Tenkan is in trouble, and the Lagging Span is also struggling to stay above this critical level. Bitcoin remains in the hands of the sellers as long as prices are moving below the cloud. This remains a very average situation as it is difficult to anticipate what will happen next.
The main support remains the $15,800 area, the former low of the November candles. A return to the clouds is necessary to hope for a more significant rebound. Note that this move could be for the beginning of 2023.
Indeed, volatility is on a long term low. We have to go back to July 2020 to find this configuration... And it preceded a huge market move. So we can expect some excitement next year!