What is a Moving Average crossover and how to take advantage of it?
Perhaps the Moving Averages are the preferred indicators for traders to include in their technical analysis, they provide us with a lot of information and smooth lines that we can easily interpret.
Edited image, original from pixabay.com.
As we know, the usual way to visualize the price chart of a cryptocurrency is through the well-known Japanese candlestick chart, but while this is the best way to follow the price action, it is also true that sometimes with so many fluctuations it can be difficult to clearly identify a trend. In that respect, the Moving Average helps us to better interpret the price movement by providing us with a smoothed line that represents the price action.
Although it should be noted that the moving average is a lagging indicator, since it provides us with the calculation of an average price based on past price data, so choosing the right number of periods taken for its calculation is essential, since the type of response of the indicator depends on this, being faster to register signals with short periods and slower, but more stable, with longer periods.
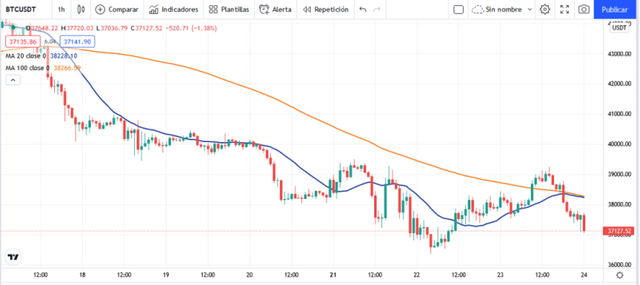
Example of Simple Moving Averages, a 20-period (blue) and a 100-period (orange) on a BTC/USDT price chart. Source: screenshot taken from Tradingview.com.
And precisely, we can use this indicator by combining moving averages of different periods to find market entry and exit signals, signals that typically come from the crossover of a fast moving average with a slow moving average.
What is a moving average crossover and how to apply it?
There are several types of moving averages that we can use in technical analysis, being the most used the Simple Moving Average (SMA) and the Exponential Moving Average (EMA), being the first one precisely a simple arithmetic average, where all data have the same weight; and the second one, is a weighted average that assigns more relevance to the most recent data.
In either case, we must bear in mind that the greater the number of periods, the more data are needed to calculate the average, which translates into more delay and the indicator line moves away from the price curve, while with short periods the indicator line follows the price more closely.
As we mentioned earlier, moving average crossover is a trading strategy based on crossing two averages of different periods, being one of short period, which is usually referred to as fast, and another of long period, which we refer to as slow. And the point we are looking for as indicative is where the crossing of both averages occurs.
Let's see the application of this strategy, in the following price chart for the AVAX/USDT pair I have added a 50 period EMA, which will be the fast one, and a 200 period EMA, which will be the slow one.
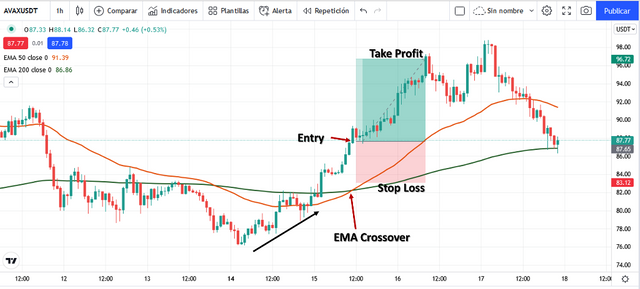
Source: screenshot taken from tradingview.com.
As we can see in the image, the AVAX prices are moving below the two moving averages, then, on the 14th begins an upward movement that leads prices to exceed both averages the next day, after this movement we see that the EMA50 (orange) changes direction and crosses above the EMA200 (green), this is the signal that confirms that we can open a long position. Now we must look for the best time to enter, as in this case I only see that prices are separated from both averages and continue to move above, I only wait two candles after the crossing of averages to make the entry. As we can see, the price experienced a good upward movement, so keeping the risk/reward ratio of 1:2 we would have achieved a good trade following this method.
Let's see the application of this strategy to enter a selling market, also for this example I have added a 50 period EMA and a 200 period EMA to analyze the price chart of the SHIB/USDT pair.
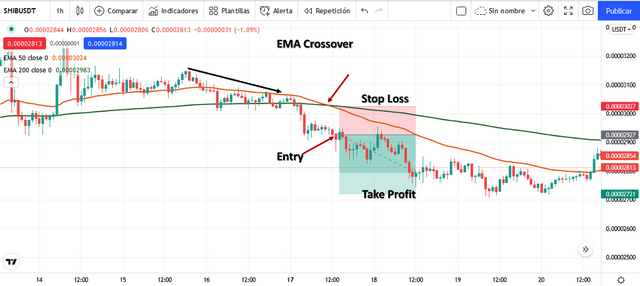
Source: screenshot taken from tradingview.com.
In the previous image we can see how prices were moving above the two EMAs, practically using the EMA50 (orange) as a dynamic support, then we see that prices break the EMA50 line and start a downtrend, later, on January 17th they break below the EMA200 (green), and shortly after we observe the crossing of the EMA50 below the EMA200, this is the signal we expected to open a short trade. Now we are looking for the best time to enter, as an approach and rejection of the EMA50, however as we see that prices just keep separating from the moving average we can enter a couple of candles after the crossover.
As we see in the image, we have a good move to the downside, placing the Stop Loss just above the moving averages and the Take Profit with a risk/reward ratio of 1:2 we would have also achieved a successful trade following this method.
We will see that it is the trader himself, with a little practice, who must determine the number of periods to use in the averages, and we must not forget that moving averages are trend following indicators, so this strategy is suitable for trending markets, and in sideways markets it is not so good, since it generates many signals that usually are not profitable.
In conclusion, moving averages are very important indicators that allow us to smooth out price fluctuations within a given time period, eliminating market noise and thus providing a clearer signal of the trend behind the price movement. And the crossover of averages is a widely used strategy that is precisely oriented to that job of filtering data and providing us with a clearer signal that we can use to enter or exit a market, which although it is possible that it generates fewer signals, those that we find are very likely to be very profitable.
Thanks for coming by to read friends, I hope you liked the information. See you next time.

I am not very good in technical analysis but I liked the article that you shared about this moving average and hopefully I will be able to learn more.
Hello friend, I'm glad you liked the information, I am also learning and I think this is one of the best indicators that we can use. Cheers!