On Balance Volume (OBV) indicator
The On-Balance Volume indicator is a tool used for technical analysis, which allows investors to make predictions about the movement of prices, based on the volume of previous transactions of a given asset, which gives it great importance especially when we analyze assets in which the volume movement is fundamental in the behavior of prices.
Edited image, original from pixabay.com.
We can say that this indicator, developed by Joseph Granville in the 60's, relates the volume with the changes experienced by the price of an asset, being then a momentum indicator that uses this volume information to provide signals that allow traders to make decisions regarding a future change in prices.
This indicator provides us with a tracking of how the price of an asset evolves according to the volume that has been traded in the period of time we are analyzing, that is, if we are analyzing a daily price chart, the volume that relates the indicator is the volume that has moved in a day.
This is a measure that records a cumulative total of volume by adding or subtracting the volume at each period, depending on the movement that the price has experienced, which makes this indicator different from the normal volume measure, as it combines both volume and price movement.
This indicator seeks to provide an early signal under the premise that a price movement is a consequence of a movement in volume, thus, if the OBV chart for a currency registers an increase, it is a sign that the trading volume is increasing during periods when the price is rising, while, if it registers a decrease it is a sign that the trading volume is increasing during price falls.
How is it calculated?
This indicator depends on both volume and price, and there are three rules used for its calculation:
- If the current price closes higher than the previous day, it is understood that the bulls prevailed and won the day, in this case the volume is added to the OBV:

- Otherwise, if the current closing price is lower than the previous day's, and therefore it was the bearish who maintained control, that volume is subtracted from the indicator:

- And in the event that the current price closes the same as the previous day, then the indicator does not change:

En las formulas, OBVi es el valor del indicador en el periodo actual, OBV(i-1) es el valor del indicador durante el día anterior.
Example of calculation
Let's consider the following data for a hypothetical asset
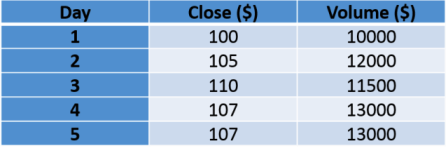
Then, the volume of the days in which the asset rose in price is added to the OBV, while the volume of the day in which the price closed below is subtracted.
- OBV of day 1 = 0
- OBV of day 2 = 0 + 12000 = 12000
- OBV of day 3 = 12000 + 11500 = 22500
- OBV of day 4 = 22500 - 13000 = 9500
- OBV of the fifth day = 9500
And on day five, when the price closed the same, the indicator did not change.
Confirmation of a trend by the On-Balance Indicator
As with other indicators, the OBV can provide us with two types of basic signals, being these of confirmation or trend change.
Bullish confirmation
We will have confirmation of an uptrend if the price of a currency rises accompanied by the increase of the OBV. Let's see an example:
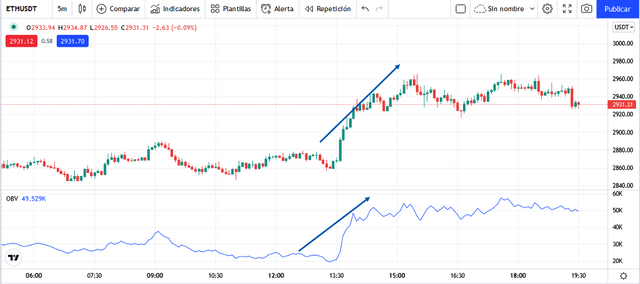
Screenshot taken from Tradingiew.
In the image above, corresponding to the ETH/USDT chart, we can see that in the indicated period the ETH price experienced a strong uptrend, and as we can see, the price increase was accompanied by the upward movement in the OBV indicator line, which confirms the direction of the trend.
Bearish confirmation
Similarly, we will have confirmation of a downtrend if the price of a currency declines accompanied by the movement of the OBV in the same direction. Let's look again at the chart for the ETH/USDT pair for an example:
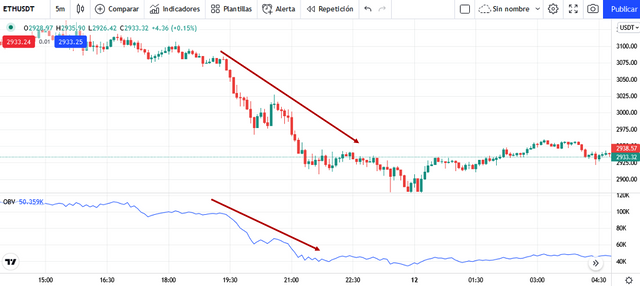
Screenshot taken from Tradingiew.
Let's observe that after the ETH price remained close to $3100, the price of this asset started to suffer a fall that placed it close to $2900. As we can see in the image, this price decline was accompanied by the movement of the indicator in the same direction, which gives us a confirmation of the downtrend.
As we can see, the OBV indicator is a great tool that can help traders to complement their technical analysis and can be interpreted by both experts and beginners, being easy enough to add to the chart to confirm a trend.
Thanks for coming by to read friends, I hope you liked the information. See you next time.

Hola amigo @emiliomoron
You have shared another indicator that I was completely unaware of, but it looks interesting.
Being able to rely not only on price but also on volume is important, as it gives the option to have two indicators in one, basically. And they are always necessary when we trade.
Thanks for sharing this information. Regards.
Hi friend, it really is a good indicator, certainly relying on both price and volume has its advantages, glad you found it interesting. Thanks to you for reading. Regards!
Hello friend @emiliomoron.
I had no knowledge about this indicator you mention, I will investigate more about it, to try to complement it in my trading strategy, it may give me good information to perform trading operations.
Hello friend, I'm glad you discovered a new tool, I hope it will be useful in your strategy. Best Regards!
thank you very much for your support!