Knowing the ROC indicator
The ROC (Rate of Change) indicator is a type of momentum oscillator that shows the percentage changes in the price of an asset, being properly designed to measure the rate of change of the price in a given period; This indicator provides us with a comparison of the current price of a cryptocurrency with the price it had "n" periods ago. For example, the ROC of 10 periods on a daily chart would determine how the price has changed from 10 days ago to today.

Edited image, original from pixabay.com.
In this way, the ROC indicator helps us visualize the momentum and direction of the trend, as well as periods of overbought and oversold, much like how indicators like the MACD and RSI work.
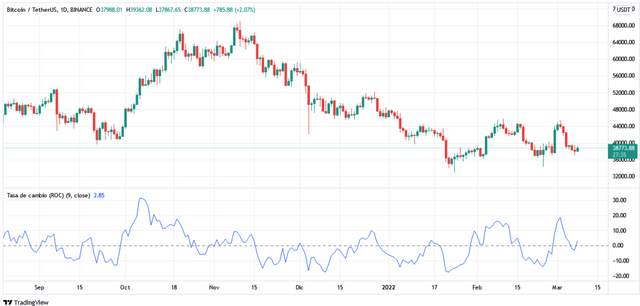
Visually the indicator presents a line that moves above or below zero, this being an expression of the price trend and the speed at which it moves, and like most momentum indicators, the ROC appears in the charts in a separate window, below the candlestick chart. This is what the ROC indicator looks like on a chart.

Screenshot taken from Tradingview.com.
Calculation form
Like other indicators, the ROC indicator is available on various platforms for chart analysis, however it can be calculated very easily using the following equation:

Where, C1 represents the current closing price and C2 represents the closing price observed “x” periods ago.
What does this indicator tell us?
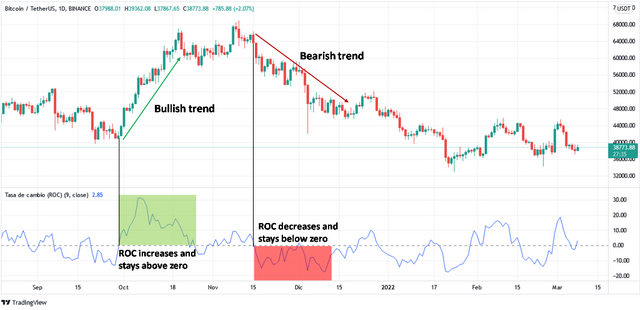
The information provided by this indicator is very easy to interpret, if the line drawn by the indicator is above the zero level, it means that prices have an upward momentum, while if the indicator line moves below the zero level It is taken that prices have a bearish momentum, with zero being the level where a price consolidation occurs.
And the further the indicator line moves away from the zero level, the stronger the trend; when it becomes more positive the uptrend is accelerating, while if its value becomes more negative the opposite happens.
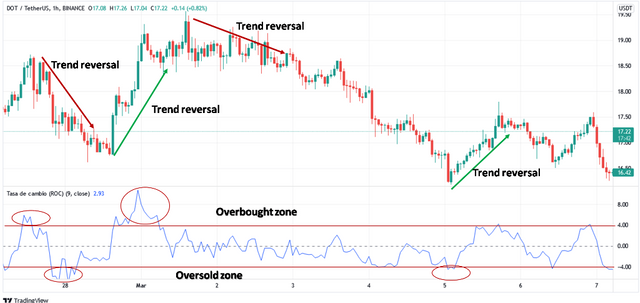
The indicator can produce a very pronounced maximum or minimum due to a lot of market activity, something that we must be aware of since this signals us periods of overbought or oversold, which allows us to act accordingly.
On the other hand, the zero level crossovers are very well used to determine buying or selling moments. If for example, the ROC indicator line crosses the zero level coming from the bottom it is associated with the start of an uptrend and is considered as a buy signal, but if it crosses the zero level from the top down it is considered the start of a downtrend so we will have a sell signal.

Screenshot taken from Tradingview.com.
Signs of a trend reversal
As we have already mentioned, the crossing of the zero level gives us a signal of a change in the price trend.
Other signals that we can consider to anticipate a change in trend are the overbought and oversold states of the asset, or a divergent movement of the indicator line with respect to prices.
To capture the moments when prices fall into overbought or oversold areas, there are no established borders as in the case of the RSI indicator, so when we use it for long periods, we have to study the asset in question for a while to discover these extremes.

Screenshot taken from Tradingview.com.
ROC limitations
One of the most important limitations of this indicator is its method of calculation, since it gives the same importance to the recent price and to the price of n periods ago, and in many cases the most recent price has more influence in the next movement of the prices. prices.
On the other hand, it is an indicator prone to swings, particularly when it moves around the center line, the reason being that when prices reach a certain consolidation, significant changes in price are reduced, which moves the indicator to the left. zero line, which can generate several false signals.
In summary, the Rate of Change indicator or ROC for its acronym, is an indicator that is based on the price, measuring the rate of change of the current price with respect to "n" previous periods, being then a retrospective measure of the current price. , but that allows us to predict future movements or explain the behavior of the current trend. However, we must not forget that no indicator is infallible, so we must combine it with other indicators that allow us to confirm the signals.
Well friends, I hope you liked the content and have brought you information of interest about this type of technical indicator. Until next time!
