4th Weekly Red Candle on Bitcoin Price Chart
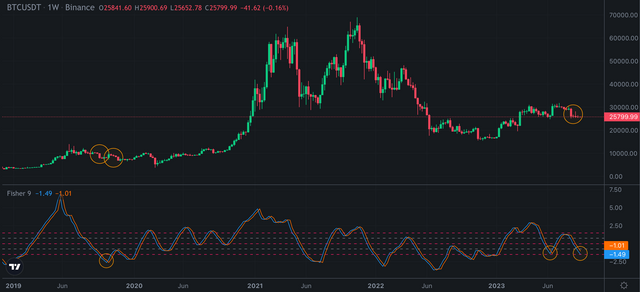
It is first time in 2023 that we have seen 4th weekly red candle on Bitcoin price chart. I shared lots of analysis and showed the similarities between 2019 and 2023 for Bitcoin price chart.
We have not seen 4 weekly red candle in 2023. We saw this red candles during Luna crash in May 2022...
So, It may be good time to pick up crypto from the bottom. It may be time to reverse after price correction. Even there are 4 red weekly candle on Bitcoin price chart, price is going down slowly...
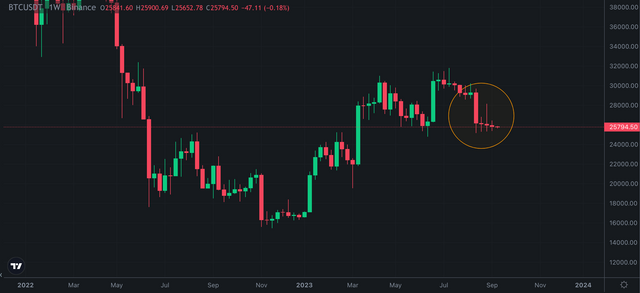
Here you can see weekly chart of Bitcoin and Fisher Indicator. I circled 4 weekly red candles on the chart. We have not seen 5 weekly red candle in 2019. So, we may not see 5 weekly red candle in 2023.
It may be time to see green weekly candle on Bitcoin price chart this week..
We will see..
Thank you, friend!


I'm @steem.history, who is steem witness.
Thank you for witnessvoting for me.
please click it!
(Go to https://steemit.com/~witnesses and type fbslo at the bottom of the page)
The weight is reduced because of the lack of Voting Power. If you vote for me as a witness, you can get my little vote.
It appears that the market may soon experience a significant movement, but the sustainability of an upward trend relies on confirmation from bullish price action, represented by a "green candle" in technical analysis. In binary trading, I understand that markets can exhibit a short-term upward trend, but it's likely to reverse direction shortly after encountering a resistance or support level.