Blockchain and Cryptocurrency Beginner - The Formation of Candlestick Patterns and Relationship to Price - Hammer and Morning Star Candlestick Pattern
The Hammer Candlestick Pattern
.png)
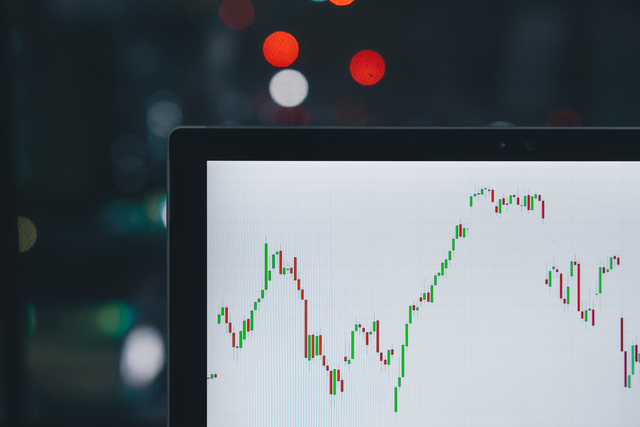
The hammer candlestick can also be bullish hammer or inverted hammer candlestick pattern, is also known as the bullish reversal pattern. It is a good indication that the market could be heading for a bullish reversal. When the hammer appears at the bottom of a downtrend, it could indicate that there could be a reversal coming. Also, the hammer forming in an existing uptrend indicates the strength of the buyers and that the buyers are still in control of the market.
Looking at my screenshot of the BTC/USDT chart, we can see the appearance of the hammer having a small body with a long wick which indicated that the market rejected lower prices. The market showed strength of the buyers and continued in its uptrend direction. We can say that after the formation of the hammer in an existing uptrend, it showed that the buyers are still in control and closed the price very close to the highs. The market continued in its uptrend direction.
The Morning Star Candlestick Pattern
.png)
The morning star candlestick pattern is a good indication that the market could be heading for a bullish reversal or an uptrend. When the morning star appears on a downward movement, it shows that the downward momentum is slowing down before there is a bullish move that indicates there is a possible reversal to an uptrend and the buyers would eventually take control of the market and drive the price up.
Looking at my screenshot of the AAVE/USDT chart, we can see the appearance of the morning star that is formed with three candlesticks, comprising of a small body red/green candlestick in-between a large red/bearish candlestick and large green/bullish candlestick. We can see that there was selling pressure from the sellers that pushed the price all the way down and closing near the lows. The next candlestick that formed was a bearish candlestick with a small body. The next candlestick that followed was a bullish candlestick with a large body. After the formation of the morning star candlestick pattern, the market went into an uptrend direction. The chart showed that after the formation of the morning star candlestick pattern, the market reversed to an uptrend movement.

You've got a free upvote from witness fuli.
Peace & Love!
Several times I have actually tried to learn this candlestick patterns but it just keep getting hard for me. At the long run I need to stick with my support and resistance