Blockchain and Cryptocurrency Beginner - The Formation of Candlestick Patterns and Relationship to Price - Evening Star Candlestick Pattern
The evening star candlestick pattern
The evening star candlestick pattern is also a bearish reversal pattern. It is a good indication that the market could be heading for a bearish reversal or a downtrend. When the evening star appears on an uptrend movement, it shows that the uptrend momentum is slowing down before there is a bearish candlestick move that indicates there is a possible reversal to a downtrend and the sellers would eventually take control of the market and push the price down.
.png)
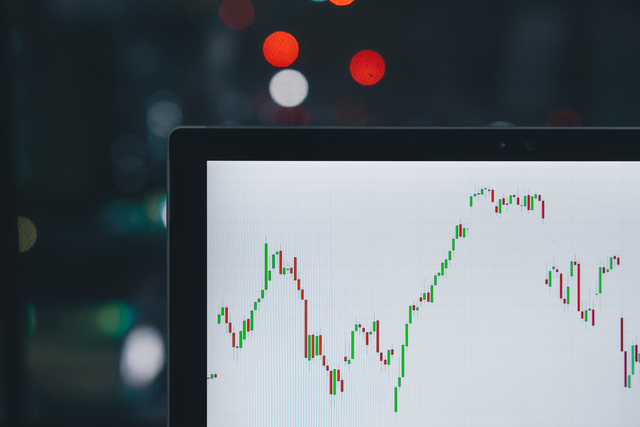
Looking at my screenshot of the BTC/USDT chart, we can see the appearance of the evening star that is formed with three candlesticks, comprising of a small body red/green candlestick in-between a large green/bullish candlestick and large red/bearish candlestick. We can see that there was buying pressure from the buyers that drove the price all the way up and closing near the highs. The next candlestick that formed next was a bearish candlestick with a small body. The next candlestick that followed was a bearish candlestick with a large body. After the formation of the evening star candlestick pattern, the market went into a downtrend direction. The chart showed that after the formation of the evening star candlestick pattern, the market went to a downtrend movement.
For this demonstration, I will be making use of the bullish engulfing candlestick pattern on the ADA/USDT price chart. I spotted the bullish engulfing candlestick pattern on the 30mins chart. I placed a buy order for 80 ADA at $1.2110 with a stop loss at $1.2014 below the bullish engulfing candlestick, and take profit at $1.2211. Once my buy order triggers, I will wait for it to hit my take profit level, if the price retraces and goes back down, my stop loss is there as a risk management strategy.
.png)
.png)
Conclusion
Candlestick patterns is one of the most popular technical analysis tools used in technical analysis. It is considered as one of the most powerful ways to determine what is happening in the market because the candlesticks gives clear indications of price actions in the market and can be used in combination with technical analysis indicators to determine the best entry point and exit point on the chart. When used correctly, candlesticks can be very powerful in helping traders make more profit.