Blockchain and Cryptocurrency Advanced - Is It Possible to Transact only With Signals Received Using the Heikin-Ashi Technique?
Is it possible to transact only with signals received using the Heikin-Ashi Technique?
In my opinion, it is very possible to use only the signals from the Heikin-Ashi Technique to trade. However, it is not advisable to rely on one technique. It is a good idea to combine it with technical indicators like MACD to get better confirmation before making any trading decisions. Using the Heikin-Ashi chart alongside the MACD indicator, it is possible to confirm the direction the market is going. When there are large body candlesticks at the end of consecutive red candlesticks, and the MACD line crosses above the signal line, it is a confirmation of an upward price movement.
.png)
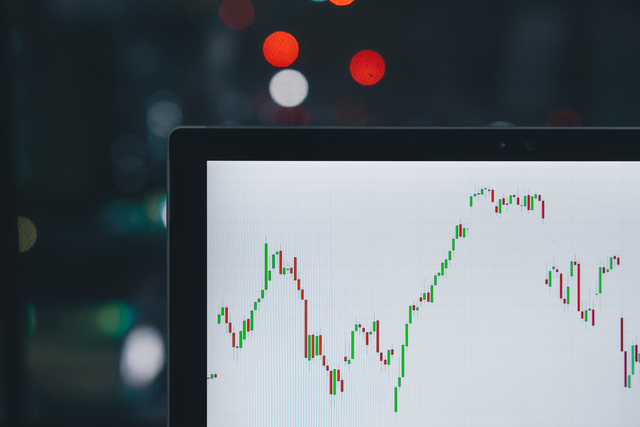
The Heikin-Ashi chart with the MACD indicator on MATIC/USDT chart
Practical demonstration of both Buy and Sell orders using Heikin-Ashi+ 55 EMA+21 EMA
Buy – MATIC/USDT
Using the Heikin-Ashi and the 55 EMA+21 EMA on the MATIC/USDT chart 4-hour timeframe, the price was about the cross above the 55 EMA+21 EMA. The large body candles that formed after a small body candlestick was a strong indication that the upward movement would continue. This for me was a good entry point to place a buy. I entered the market at 1.383 USDT and using the 1:2 risk-reward, I set my take profit at 1.484 USDT and my stoploss at 1.334 USDT.
.png)
.png)
Sell – BNB/USDT
Using the Heikin-Ashi and the 55 EMA+21 EMA on the BNB/USDT chart 4-hour timeframe, the price was below the 55 EMA+21 EMA lines. Even though there were large body candles that formed after a small body candlestick, because the price was still under the 55 EMA+21 EMA lines, I decided to take a short position because there is still a possibility that the price could reverse downwards. For me, I placed a sell. I entered the market at 415.7 USDT and using the 1:2 risk-reward, I set my take profit at 401.1 USDT and my stoploss at 423.6 USDT.
.png)
The Heikin-Ashi chart has proven to be a very powerful technique and very beneficial when it comes to trading. The colour of the Heikin-Ashi candlesticks is great for showing the direction of a trend and also show when there is about to be a trend reversal just by the candlesticks alone. This is why it is very useful in trading. Nonetheless, regardless of how great the Heikin-Ashi is, it is always important to combine it with technical indicators like MACD or the 55 EMA + 21 EMA so as to make the best trading decision.