Blockchain and Cryptocurrency Advanced - How to Use the Volume Indicator to Have a Signal Confirmation and How the Volume Indicator Reflects the Evolution of Prices in The Charts
Signal confirmation is one of the usefulness of the volume indicator as it can be used to confirm signals before taking a trading decision. The volume indicator bars is great for breakout confirmation.
For support breakout confirmation
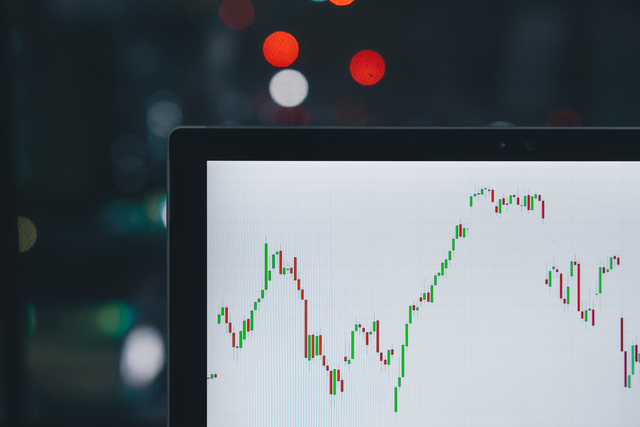
During a support breakout, the selling volume bars would show an upward increase slope of the selling volume which is an indication that there are more selling pressure going on in the market which caused the price to break below the support level. The breakout point on the candlestick chart corresponds with the tallest selling volume bar around the breakout region. On the AAVE/USDT chart, we can see the support level. The breakout point corresponds with the upward slope of the selling volume bars.
.png)
AAVE/USDT Chart
For resistance breakout confirmation
During a resistance breakout, the buying volume bars would show a spike or an upward increase slope which is an indication that there are more buying force going on in the market which caused the price to break above the resistance level. The breakout point on the candlestick chart corresponds with a spike or the tallest buying volume bars around the resistance breakout region. On the AAVE/USDT chart, we can see the resistance level. The breakout point corresponds with the spike and upward slope of the buying volume bars.
.png)
AAVE/USDT Chart
How the volume indicator reflects the evolution of prices in the charts
Volume and price action have a very close relationship which is noticeable on the charts. What this means is that the volume of a particular cryptocurrency asset reflects on the price. When there is a significant increase in volume, there is a greater chance that there is also a significant increase in the price of the particular cryptocurrency asset. Volume is basically the quantity of the particular cryptocurrency being traded in the market by traders, which means more buyers or sellers are either buying or selling the particular cryptocurrency.
This has a close relationship with the price of that particular cryptocurrency. For instance, if there is an increase in buying volume, it means that the buying pressure is increasing as well. This will show in the price as there will be a rise in price. Likewise, if there is an increase in selling volume, it means that the selling pressure is increasing as well. This will also show in the price as there will be a fall in price. Also, if there is a decrease in volume, it means that the quantity of the asset being traded in the market is weakening and that there are low trading activity in the market.
From the MATIC/USDT chart below, we can see that in the uptrend, there was also an increase in the volume. The buying volume bars was increasing which indicates that there are more buyers in the market trading.
.png)
MATIC/USDT Chart
From the MATIC/USDT chart below, we can see that in the downtrend, there was also a decrease in the volume. The buying volume bars was decreasing and then there was a cluster of many selling volume bars that followed next. Also, we can see the area of huge price drop which was also reflected on the volume as there was an increase in the selling volume.
.png)
MATIC/USDT Chart
Question 5b - Why does the volume sometimes anticipate the price?
Since volume and price have a very close relationship, it means that volume can also anticipate price movement. What this means is that volume tells a lot what is going on in the market in terms of trading activities of buyers and sellers. For instance, when the price is still low and there is a rise in the selling volume bar, if there is an increase in the buying volume, there it can be a signal that there are more buyers entering the market which could push the price up.
From the BNB/USDT chart, we can see the region where the price was falling, the selling volume was also increasing. After that, the selling volume began to decrease and there was an increase in buying volume that followed next. The cluster of buying volume bar was an indication that more buyers have entered the market and the buying pressure has suppressed the selling pressure. It didn't take long for the price to enter an uptrend.
.png)
BNB/USDT Chart

I think this volume indicator is really key because it most of the time gives you direction on which the market will goes
Hi @chimzycash, thanks for sharing this educational article about some technical indicators, it is very helpful pr the community. See you later, have a great week.