Cryptocurrency Trading Strategy | Buy and Sell Signals
Based on the chart here are some key points to consider for making a buy or sell decision:
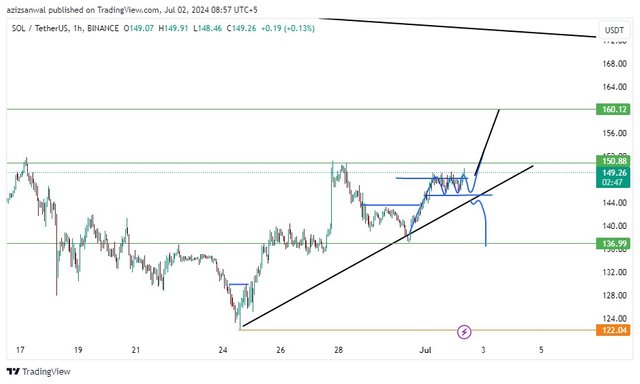
- Support and Resistance Levels:
Support: Around $136. 99
Resistance: Around $150. 88 and $160. 12
- Trend Lines:
There is apparent upward tendency of the line in the graph this can be seen by the successive points of the ascending line.
A probable break out above the $150. This means that $88 could be an entry buy signal to the next resistance level of $160. 12.
- Price Action:
- Should the price go below the trend line and fall to the $136. The two moving averages are the 100 SMA and the 99 support level, when such a situation occurs it could be a sell signal and opportunities to sell maybe around the $122 level. 04.
Buy Signal:
- To trade in this stock, you should open your buys on any breakdown and then hold on any higher price above $150. 88 with strong volume. Look for the next resistance at $160. 12.
Sell Signal:
- Sell if the signal line moves down the crossed Bollinger while holding above $136. 99 support level. This means that target lower levels should be set around $122. 04.
In each trade, it is obligatory always to employ stop-loss orders to control the level of risk. Using a stop order where the stop-loss is positioned slightly below the breakout when going long or a little above the breakdown if going short is recommended.
Sort: Trending
[-]
successgr.with (74) 2 months ago
