BITCOIN: The Trend Line Battle
A few words
Assuming that we're going to see another rejection at the well-known descending trend line, here is the more detailed version of my previous article, where I mentioned that I'm looking for a sweet spot to enter a short position. This article is about the battle between the linear and logarithmic charts and is written from a "bearish" perspective.
Using the logarithmic scale
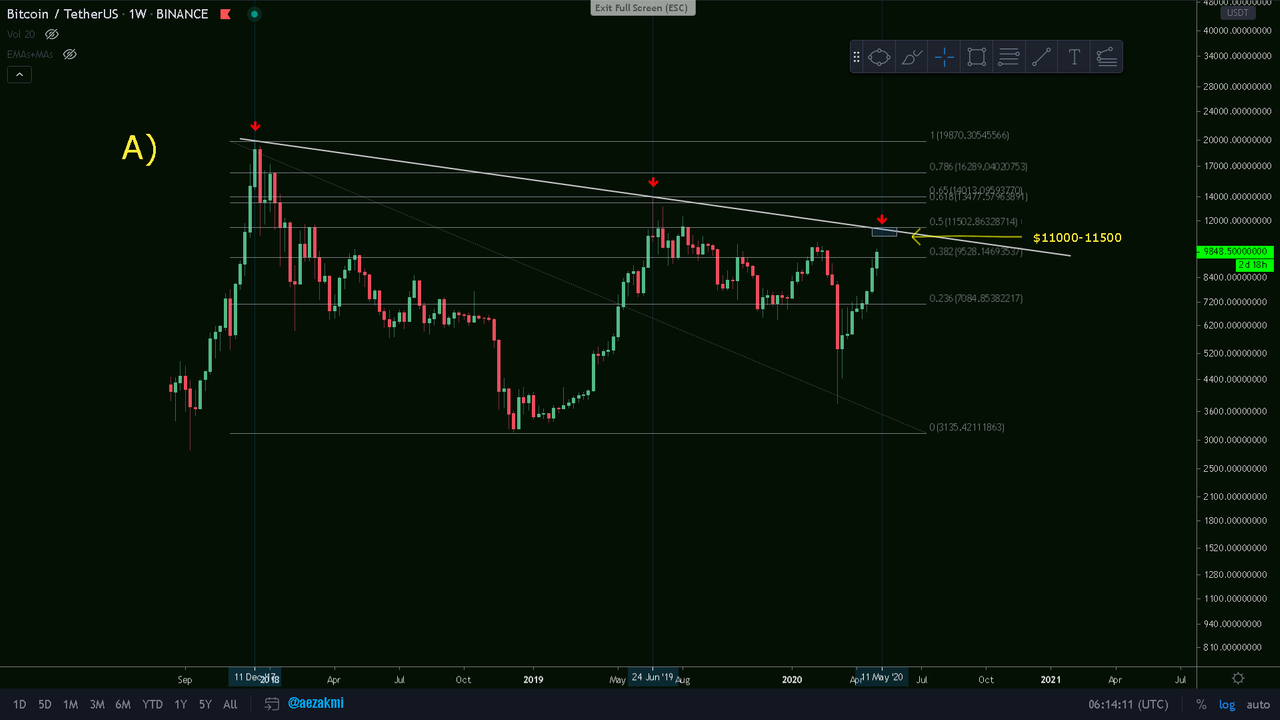
In the first situation (A), I'm using the logarithmic chart to determine the position of the descending trend line. This trend line captures the highest points on previous local highs, marked with a red arrow - Dec 11, 2017 & June 24 2019. As you can see, we're close to this trend line once again and it's probable to interact with it in the upcoming period. If we're going to get another local high at this specific trend line, it's gonna be somewhere between $11000-11500, based on if we're getting there this week or the following ones. Another aspect to look at is the 0.5 Fibonacci retracement level ($11500) of the Dec. 2017 - Dec. 2019 price movement. Keep in mind that the previous local high - June 2019 - reached exactly the top of the golden pocket ($14000) of this same Fibonacci retracement; therefore, reaching now the 0.5 if quite possible.
Ctrl + Click here to enlarge the image in a new tab (steemitimages)

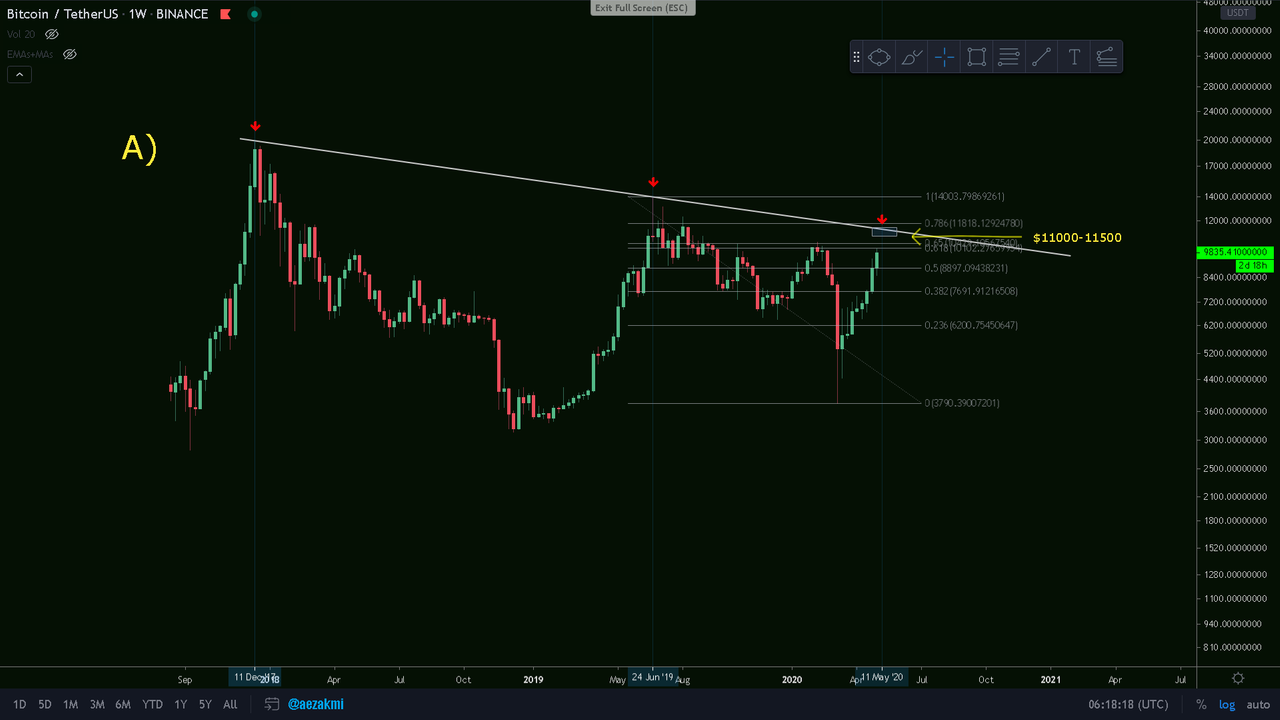
Still on the logarithmic scale, I'm now using the Fibonacci retracement on the June 2019 - March 2020 movement. As you can see, the trend line does not align with any Fib. level and reaching it, means for us first to break the 0.618-0.65 golden pocket resistance, together with the Feb. 2020 local high.
Ctrl + Click here to enlarge the image in a new tab (steemitimages)
Using the linear scale
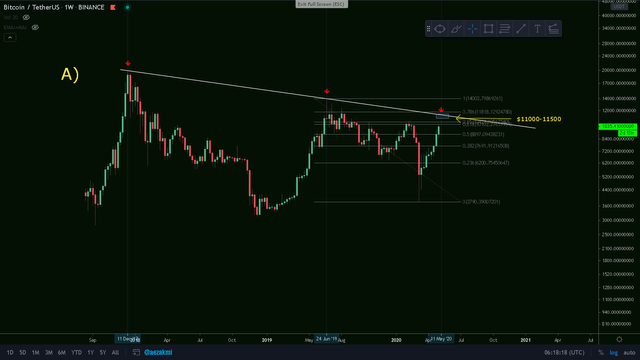
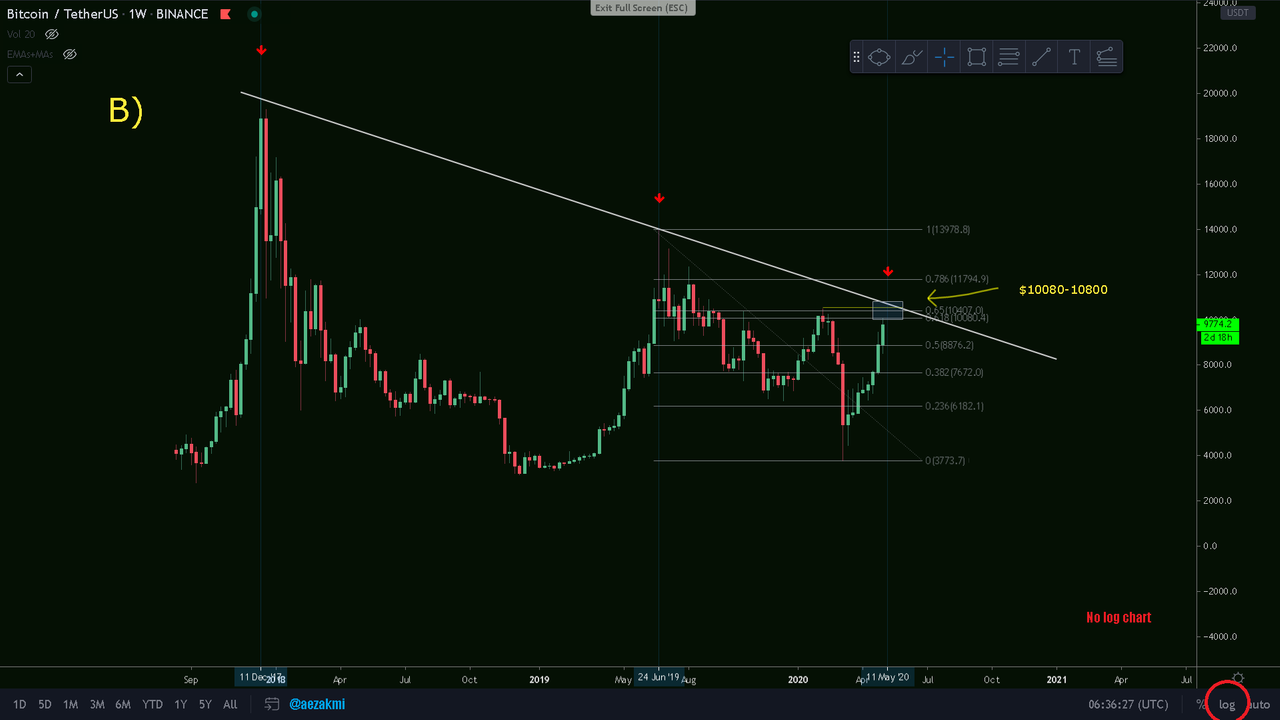
In the second situation (B), I'm now using the linear scale to determine the position of the previously mentioned trend line. The trend line still captures the previous local highs, marked with red arrows - but a significant change is to be seen when trying to determine the next local high. Based on when we're going to do so, this specific level is somewhere between $10500-10800, does not align with any Fibonacci retracement levels of the Dec. 2017-Dec.2018 price movement, but is near the local high from Feb. 2020 ($10500). Considering this specific price action, we could see some sort of a double-top pattern in the following week(s).
Ctrl + Click here to enlarge the image in a new tab (steemitimages)
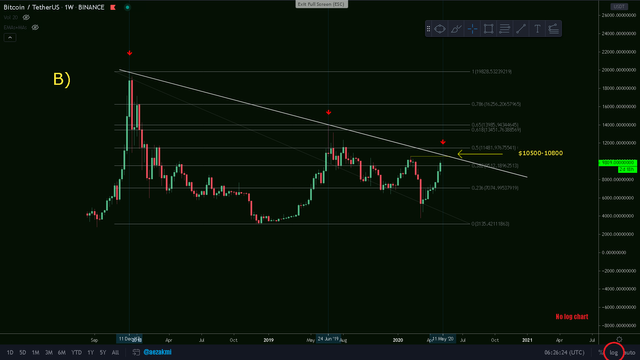
Still on the linear scale, I'm now using the Fibonacci retracement tool on the June 2019 - March 2020 price movement. As you can see, we have the golden pocket between $10080 (we already reached this level last night) and $10400, the previous local top $10500 and the descending trend line at 10700$ - so a lot of resistance is in this area.
Ctrl + Click here to enlarge the image in a new tab (steemitimages)

Conclusion
As far as I know, most traders are using the logarithmic charts (A version), but I find it important to also see the other side of the coin. Assuming that we're going to see another rejection in the following period, either using the logarithmic or linear chart, there's the $10080-11500 area which represents our major concern right now. It's up to you now to decide what chart works best for you and whether you're a bull or a bear these days.


Thanks for reading and safe trading!✌
If you find this post useful, please:

Hello @aezakmi
Thank you for posting within our community. I upvoted your content already.
However since your post is strictly related to crypto - I would suggest to subscribe to HOLD community. It's a quite new community managed by @vlemon and it's dedicated to topics related strictly to cryptocurrencies.
Their discord server: https://discord.gg/dmcaQrn
Yours, @crypto.piotr
Hello @crypto.piotr and thanks you for the support.
As you probably know, I'm new to this community. I followed @steemcurator06's message from my last post to join this community.
This is a part of that message:
I am quite old to the steemit platform and I can say that the audience for crypto articles is in general not that big. Therefore, I joined your community hoping to find more readers for this particular subject and, as I can see among the posts, there are people who target this specific domain.
However, I'm also joining the HODL community on your recommendation.
Thanks again for the input.
Cheers!
Hello @aezakmi !
Very interesting article which is quite different from other analysis, I can understand that you expect Bitcoin to be capped by this trendline ? So no 11k$+ breakout in your opinion?
The HODL community is going to really start on Steem this weekend and we would be glad to have you onboard !
Sincerely,
@vlemon
Hello @vlemon and thanks for the reply!
In my opinion there's a good chance for us to see a rejection at this trend line, followed by a bounce and perhaps only afterwards a real breakout - but nothing is certain. We already have 8 green weekly candles in a row, which is kinda strange for us already. Closing the monthly candle above $11500 should be a clear bullish sign.
Regarding the HOLD community, I already joined it and I'll be around.
Cheers!
@aezakmi bitcoin will move for sure with this halving coming nearer. just wait for some time to cross the trend line.
I'm not so sure about it, quite doubtful actually. This could be a massive bull trap.
Cheers!