STATISTICS RISK ANALYSIS
In measuring frequency and severity, we are brought into contract with statistics. This interplay between frequency and severity of risk now leads us into statistical risk analysis.
Statistics can be classified into two types
(a) Descriptive.
(b) Inferential statistics.
DESCRIPTION STATISTICS
Description statistics deals with the systematic collection of information, presentation and description. When such information is collected, you tend to present it in a manner which illustrates the main features, such as Bar charts, Pie chart, Histogram and Pictogram.
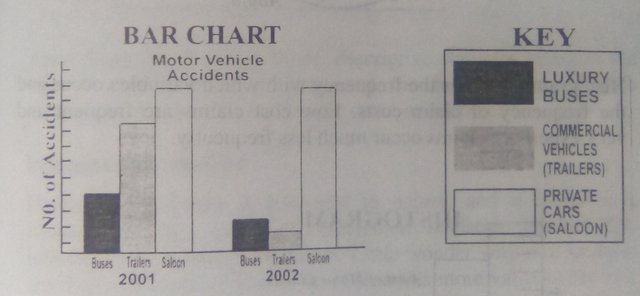
The bar chart at a glance shows the number of accidents of each type of motor vehicles for the 2001 and 2002. It will be observed that commercial vehicle accidents reduced while private cars and buses almost remain the the same.
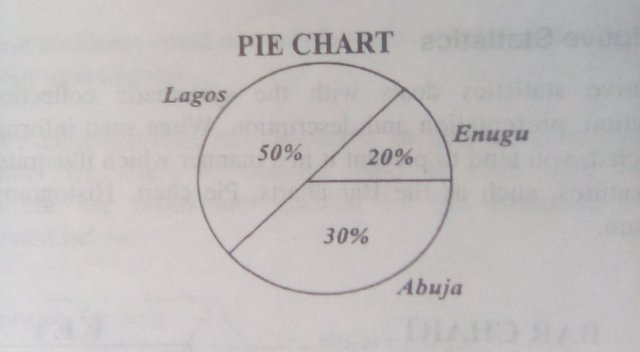
The Pie chart show division of claim among the three geographical areas. Accidents in different geographical areas compared each action of the pie reflecting a proportion of the total number of claims in that area.
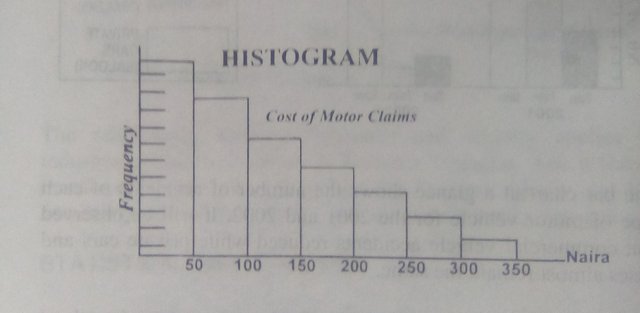
Histogram measures the frequency with which variables occur and the frequency of claim costs. Low cost claims are frequent and very expensive claims occur much less frequently.
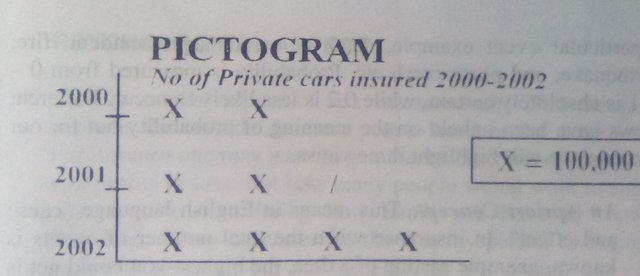
The Pictogram is a pictorial representation of a set of facts, and is often seen in newspapers, television set etc. Here each x is equal to 100,000 cars insured. In 2000 insurance year, 200,000 cars were insured, with an increase to 250,000 in the year 2001 and Subsequent increase in 2002 to 400,000 cars insured.
Apart from the above methods, statistics involves the use of measurement of data and the best known of such measurement being the arithmetic mean or average.
INFERENTIAL STATISTICS
Descriptive statistics is historical in nature, and it looks back illustrating what happened. Inferential statistics utilitizes this information in making Inferences. Little wonder why risk analysts are more comfortable with it since it seems more value to the risk analysts. For instance, assuming insurance company wants to collect information on the proportion of accidents involving woman drivers. They would simply gather information from a small group (sample), and then make some Inference about the entire population of woman drivers. On the other hand, in the medical perspective, a doctor takes a blood sample and on the basis of that sample is prepared to make some Inference upon that evidence. In the same manner, insurance company while takes a sample of claim and bases some Inference upon that evidence.
Thanks for stopping by and upvotes.


Weldon @joseph665 we are glad to see you posting good content like this on steem Nigeria community.
This post has been curated by the community account. Don't forget to claim the contributor badge and the official Member badge by donating 1 steem and setting 20% beneficiary to @steemnigeria01 to stand a chance of recieving better curation next time.
Ok thanks I will do just that