Top And Worst Asset Performers For The Week Of 1/20/20

Intermarket analysis is a powerful tool that gives traders/investors a macro predictive direction of stocks, bonds, commodities and currencies. Intermarket analysis states that all asset classes are interrelated and that you can’t definitively determine the direction of one asset class without examining the other asset classes.
There are several key relationships that bind these four markets together. These relationships include:
The INVERSE relationship between commodities and bonds.
The INVERSE relationship between bonds and stocks.
The POSITIVE relationship between stocks and commodities.
The INVERSE relationship between the US Dollar and commodities.
The overall goal of the intermarket analysis is to identify top performers or the markets that are outperforming others. With all that said, the top and worst performers from this past week are the following:
Top Performers
S&P 500 VIX: 7.07%
The VIX measures the volatility over the last 30 days on the S&P 500. Also known, as the fear gauge, VIX values greater than 30 represent risk off trading environments. This week the world and the financial markets have been rocked by the corona virus. According to the NY Times, official death toll from the mysterious coronavirus increased by more than a half-dozen in the last 24 hours to 26, while the number of confirmed cases jumped by more than 200. This afternoon, we witness the DOW off by 300 points, only to rally towards the end of the day.
However, the Johns Hopkins Center for Health Security, the World Economic Forum and the Bill & Melinda Gates Foundation performed a simulation which showed the virus cold could kill 65 million people within 18 months. I would say the VIX has certainly bottomed.

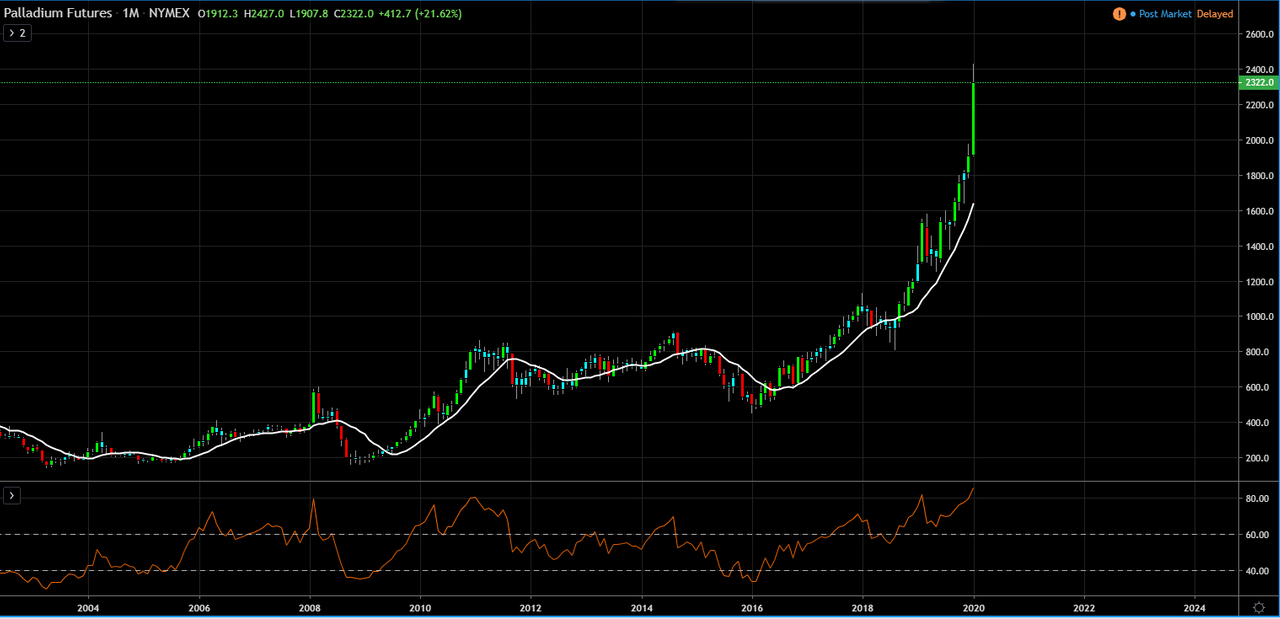
Palladium: +6.03%
The palladium market has been in a “prolonged deficit for a decade,” says Johann Wiebe, lead metals analyst on the GFMS team at Refinitiv, a global financial-data provider. Demand for palladium has been “booming and supply has just not been able to keep up with it,” Wiebe says. “Car sales are under pressure,” he says, but that’s “offset by a rise in metal requirements on the back of tightening emission legislation across the major regions, including India, China, the U.S., and Europe this year.
Class III Milk: 3.76%
Class II refers to milk going into 'soft' manufactured products such as sour cream, cottage cheese, ice cream, and yogurt. Class III refers to milk used for making hard cheeses. Class IV milk is used to make butter and dry products such as non-fat dry milk
Worst Performers
Natural Gas: -8.91%
Prices continue to break down, breaching both daily demand zones and even the long standing 10 year support at the physiological whole round number of $2.000. The weather is expected to be warmer than normal for the next 6-10 and 8-14 days according to the last forecast, so expect prices to remain depressed.

Gasoline: -8.14%
Oil: -7.14%
Oil is down three straight weeks, but this week it's down due to concern that the coronavirus in China will spread, hurting travel and fuel demand. However, I'm looking for the weekly demand to hold once gain.

This post is my personal opinion. I’m not a financial advisor, this isn't financial advise. Do your own research before making investment decisions.

Posted via Steemleo