Understanding Market Structures on Multi-Timeframe - Written by @msquaretwins

Introduction

Hello Steemians!
I welcome you to another beautiful day this glorious week. I hope you have been enjoying your week. I am Kehinde Micheal and my username is @msquaretwins here on this great platform. Today again, I have come with an interesting topic, and I do hope that it will be educative. Today, I will be explain the topic 'Understanding Market Structures on Multi-Timeframe". Please follow me closely as I explain this interesting topic. Happy reading!

Understanding Market Structure on Multi-TimeFrame

Monthly Timeframe
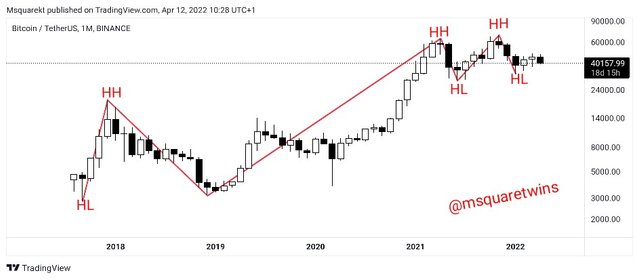
The picture uploaded below is a chart of BTCUSDT on a monthly timeframe. As we can see in the screenshot below, the asset has a general bullish trend as the price is making series of higher highs and higher low. In essence, BTC/USDT has been on a bullish trend since it deployment on trading view on monthly timeframe as we can see in the screenshot below.
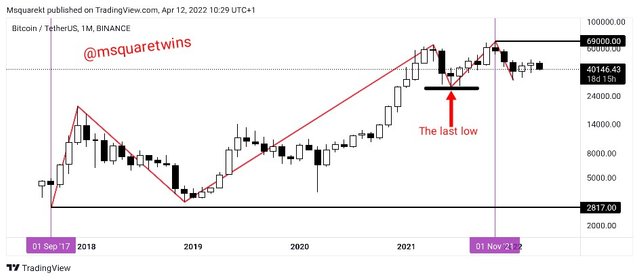
Also, we can see that the lowest low recorded by this asset on tradingview chart was on Sept. 1st 2017, which was a month after the appearance of this asset on tradingview. The price of BTC was $2,817 as seen in the screenshot. Then after this lowest low, we can see that BTC price has since then been on a bullish trend. And we see that the highest high attained by BTC was on Nov. 1st, 2021 with BTC recording a price of $69,000. Then after this, we see a retracement from that time, but it didn't break the previous low as indicayed in the screenshot. So with this, we cam be certain that the general bias of BTC/USDT is bullish.
Weekly Timeframe
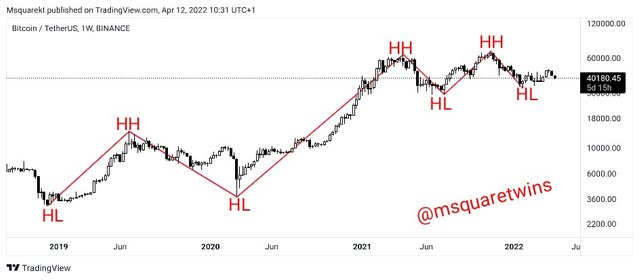
Then I switched to weekly timeframe as seen in the picture uploaded below. The weekly timeframe also have the same bias with monthly timeframe as price keeps making series of higher highs and higher lows as also confirmed by market structure.
Daily Timeframe
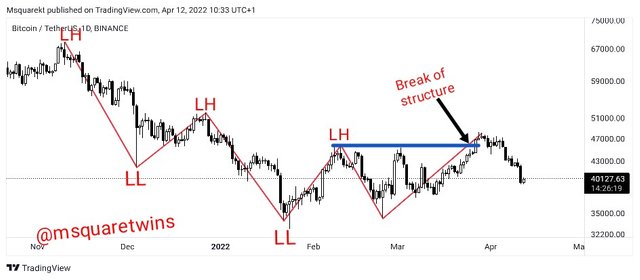
Then I changed the chart to daily timeframe as seen in the screenshot below. Don't forget that according to monthly and weekly timeframe, the bias identified is bullish bias. Now lets check the daily timeframe as uploaded below. In the picture below, we see that price was making a series of lower highs and lower lows, which was contrary to what price is doing on monthly and weekly timeframe. This means that, price can be bullish on monthly and weekly timeframe but bearish on daily timeframe. Just a few days ago, we then see price broken the previous high on daily time frame. Then after a break, we see the current retracement that price is making.
4hour Timeframe
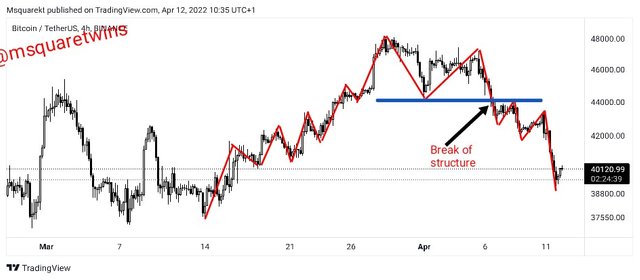
Then I switched the chart to 4h Timeframe as seen in the screenshot below. As we can see in the screenshot, price was previously making a series of higher highs and higher lows. Then at a point, price break the structure to the downside turning the trend to a bearish trend. On this timeframe, price is currently bearish as we can see in the picture uploaded below.
1 Hour Timeframe
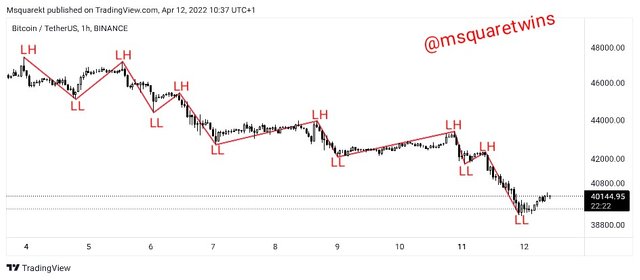
The chart uploaded below is the chart of BTC/USDT on a one hour timeframe. As we can see in the screenshot below, price is making a series of lower highs and lower lows, and this means that the trend on this timeframe is bearish. I believe, you can see the magic of market structures on each timeframe. Let's switch the chart again to lower time frame to see what price is doing.
15 Minutes Timeframe
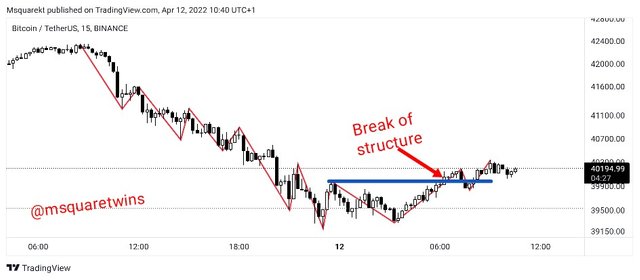
The chart uploaded below is a chart of BTC/USDT on 15 minutes timeframe. As we can see in the screenshot below, price is about to turn to a bullish trend as price just broke the previous significant high as indicated in the screenshot below. Now, traders who follow closely can deduce what to do here, a buy order at this time may be advisable simply because, the 15 minutes timeframe just align with monthly, weekly and even daily timeframe that just broke structure upward. This will mean following the trend in market. Let's see one lower timeframe.
3 Minutes Timeframe.
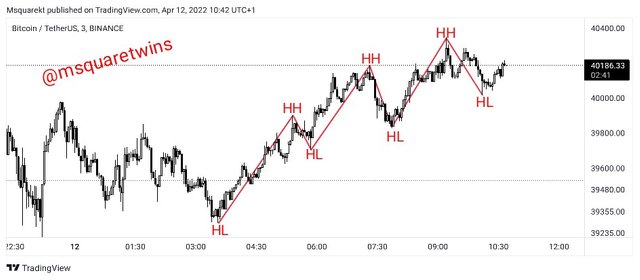
The 3 minutes chart is uploaded below. As we can see in the screenshot below, the current trend on this timeframe is also bullish which also align with Monthly timeframe, weekly timeframe, and 15minute timeframe.

Summary

From the multiple timeframe we have analysed above we can see that price may be bullish in one timeframe and bearish in another timeframe. The best way a trader can position himself for a good trade order is to understand what price is doing by studying and analysing price movement on multiple timeframe. This will help him to understand price movement. For example, we see that we have the same bias in monthly, weekly, 15minutes and 3 minutes timeframe, while 4hours and 1 hour have the same bias. A long time traders may consider what price is doing on Monthly and weekly timeframe in making trade order. Therefore it is very important to understand market structure on each timeframe.
Thank you for reading through.
Note: You must enter the tag #fintech among the first 4 tags for your post to be reviewed.
Thank you so much. I will keep making quality content.