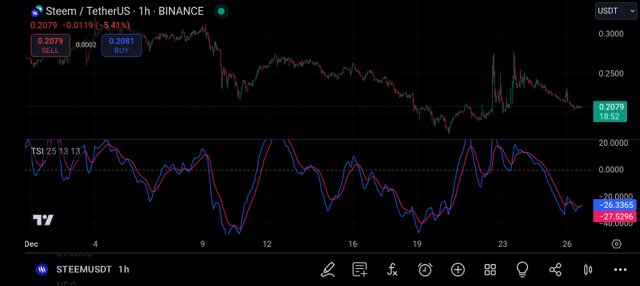
Understanding the True Strength Index (TSI) Indicator
Thousands of indicators are designed for analyzing the financial market and TSI is among the best Indicators one can use and analyze the crypto market which this post is for us to know about.
True Strength Index (TSI)
In Tradingview, under the indicator search bar, when you type in TSI in the search bar, you will see the true strength index appear. A financial expert called William Blau is the person who developed the indicator to be a momentum oscillator indicator.
TSI is used in the financial markets to measure the strength of a price trend of an asset by taking into consideration the smoothing and momentum of an asset. As a trader, by using true strength index (TSI) you will be able to identify the conditions of overbought and oversold, trend continuations, and as well potential reversals.
Key Features of TSI
TSI has three key features which are: zero line cross, divergences and oversold/overbought conditions. Let's discuss these features one after another.
Zero Line Crosses: In TSI when you see a cross that is above the zero line indicating a bullish momentum you should know that the market is moving in an uptrend, whereas if it is below the zero line indicating bearish momentum it means the market moving in a downtrend.
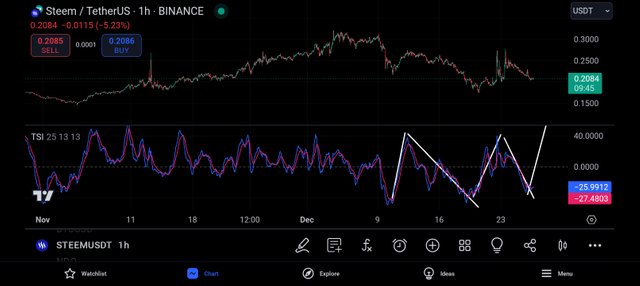
Divergences: In TSI a bullish divergence happens when the price of the asset you are analyzing makes a lower low, but the TSI makes a higher low. In the case of bearish divergence, it occurs when the price of the asset makes a higher high, but the TSI makes lower highs.
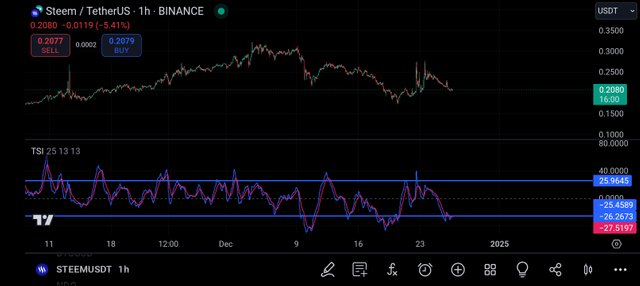
Oversold/Overbought Conditions: In TSI, two levels are very common. + 25 is an overbought level, whereas -25 is an oversold level both levels can vary based on market conditions.
Calculation
It is very easy to calculate TSI and all you need to do is calculate the differences between the prior closing price and the current closing price the formula below is what you need.
Δ=Close - Close - 1
At this point, we will have to smooth the Δ by using a short exponential moving average (EMA1).
The result of the EMA1 will need to be smooth again using a long-term exponential moving average (EMA2).
After the above smooth, repeat the steps 2 and 3 to get the absolute value of Δ.
Finally, calculate the TSI: EMA2(EMA1(Δ)) ÷ EMA2(EMA1(Δ)) × 100
In TSI you can identify trends, which helps you to confirm the direction of the trend based on the momentum of the market. You can also confirm reversals, which is an indication of potential trend reversal when the indicator crosses key levels or changes its direction. Finally to this, it assists in gauging the strength of the movement of price.


https://x.com/AkwajiAfen/status/1872328527972110361
Note:- ✅
Regards,
@jueco