BTC Daily Technical Analysis: The S&P 500 is Bearish / BTC is very Close to an Explosion / High Confluence on ATOM.
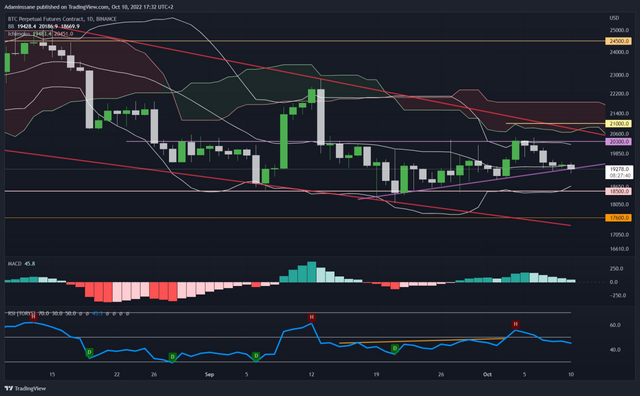
The Bitcoin in Daily is close to exploding downward!!!
If today we close at the bottom of the middle band of the Bollinger bands, and at the bottom of the trend line as support the decline can continue until 18.5K to 17.6K as next supports.
The Bollinger bands in compression which soon indicates a strong downward or upward movement.
The MACD soon in the red with a weak bullish Momentum.
The RSI has confirmed the bearish divergence and below the 50 level in the oversold zone.
The trend remains bearish since we are at the bottom of the Ichimuku cloud.
I added two technical indicators to my confluence trading system.
1- Bollinger bands:
To prepare for a strong move after a break out of the bands, and also for reversals on the high or low band with divergence on the RSI, MACD and OBV.
2- Ichimuku Cloud: I only keep the cloud for an overall view of the trend, so at the top of the cloud is bullish, at the bottom is bearish, and inside is neutral.
The cloud can act as a support and resistance which can reject the lower price as resistance or the price can bounce off it to continue higher.
https://www.tradingview.com/x/GdEWkD3T/

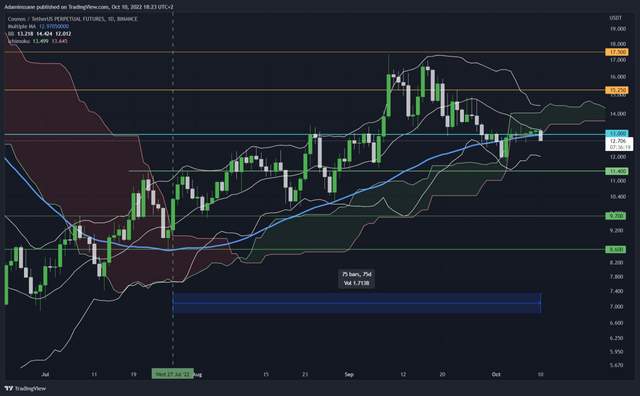
Since the bullish rally on ATOM on July 27 after the Ichimuku cloud came out from above we have been above the cloud for 75 days, and now with today's candle the Daily trend is turning bearish if we closed this evening at the bottom of the cloud.
High confluence on a bearish reversal:
- The break out from the bottom of the MA 62 in blue.
- The rejection of the middle band of the BB.
- Multiple candles with long wicks failing to close above the key resistance level at $13
https://www.tradingview.com/x/7vc39fdT/

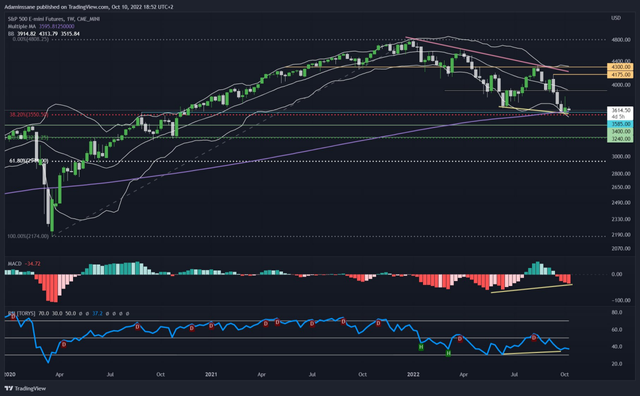
The S&P 500 not bullish, but to watch the 3585 on the MA 200 Weekly that we have already bounced on it once with a candle that has a long wick up and a small body down which shows that the sellers still have the Momentum and it is clearly visible on the MACD.
The bullish divergence on the RSI and the MACD to be confirmed if we bounce on the lower band of the Bollinger bands in confluence with the key support level at 3585 and the 38.2% fibo.
https://www.tradingview.com/x/Ec6zZUe4/

👉 Follow the links below to the best & Secured Exchanges that I use for trading & often gives rewards for using their platform like Learn & Earn Program, making deposit & Trading on spot or Futures, Trading Competition, ...etc.
📈 Bybit: Get up to 4030 USDT in rewards just by signing up!
https://www.bybit.com/app/register?ref=7Wgmj
📈 Binance: 10% discount on Binance Futures trading fees!
https://www.binance.com/en/futures/ref/38451215
📈 FTX: Sign Up Bonus of 5% fee discount on all your trades.
https://ftx.com/referrals#a=1768923
📈 Phemex: Up to $180 in welcome bonuses waiting for you.
https://phemex.com/register?group=718&referralCode=BAR9K
📈 Kucoin: Rewards for users Up to 10 million USDT
https://www.kucoin.com/ucenter/signup?rcode=Kvyf2d
📈 Bitmex: Up to 80 BMEX Tokens Welcome Offer.
https://www.bitmex.com/app/register/xXePh3
👀 Follow the Links Bellow to my Telegram Channels:
☑️ English: https://t.me/tradingwithbinance
☑️ French: https://t.me/Adaminssane1