Mini Crypto Program Part 1 || "Let's create an account on TradingView" by @rizkiblangpadang


Before I start my first homework in this Mini Crypto Program, I would like to thank Sister @liasteem as the initiator and mentor of our participants in this program. Reviewing is something that I have loved for a long time, this time we are reviewing the TradingView site.
As usual, I always insert a music video in my posts, this time a very meaningful song from The Killer, please enjoy while reading my review.

There is a proverb that is very well known in Indonesia "Tak kenal makanya tak sayang" or in Dutch it is "onbekend, maakt onbemind" which has the same meaning as "Unknown, Unlove."
Of course the proverb is not only in terms of getting to know someone but also in the context as it is today, to like and use the TradingView site, of course we must first understand what the advantages and disadvantages are before we use it.

Tradingview is also a place for traders and investors to exchange information. Like an information center that provides any relevant information about the global market. Here we can also find trading analysis that is very helpful for us when it comes to exchanging stocks, crypto, and Forex.
Of course, as someone who is new to the crypto world, TradingView is like a guide for me to explore the world of global markets, especially cryptocurrencies. Then here too we are not charged any additional hidden fees and there is no transmission of our data to any hedge fund.

For me as a new crypto user, TradingView is the right place to learn besides cryptocurrency I can also learn other things about global markets. This site also has a mobile friendly application, so it will be easier for us to operate it. My advice for those who haven't used TradingView, now is the time.
Open the site link TradingView.com, then a page containing a climber who is looking at a cliff will greet us, and the words "look first" seem to invite us to take a look at this application before we register.

Then in the second picture, a climber is seen conquering the cliff he saw earlier and then there is the word "look first, then jump". Simple words, but full of philosophy that reminds us, when we are satisfied to see how the state of this site is, now is the time to navigate the complex world of trading.

Scroll down and you'll find out what this site offerred.


We already know the advantages and disadvantages of TradingView, so now is the time to register for our account. So that everything is centralized I use my google account to register. Here are the steps:

Go to the site link TradingView.com, then click on the person symbol in the upper right corner. Then the sign-in option appears, and click on it so that the following screen appears.

Just choose which media you want to use, I prefer a google account so that everything is centralized in one account. Because there are too many accounts, it's too much trouble for me.

After selecting a google account, I was automatically directed to the home page of this site, with my photo in the upper right corner, meaning that my account registration was successful.

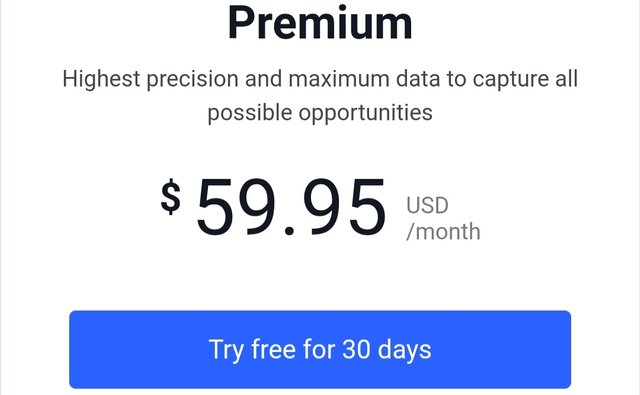
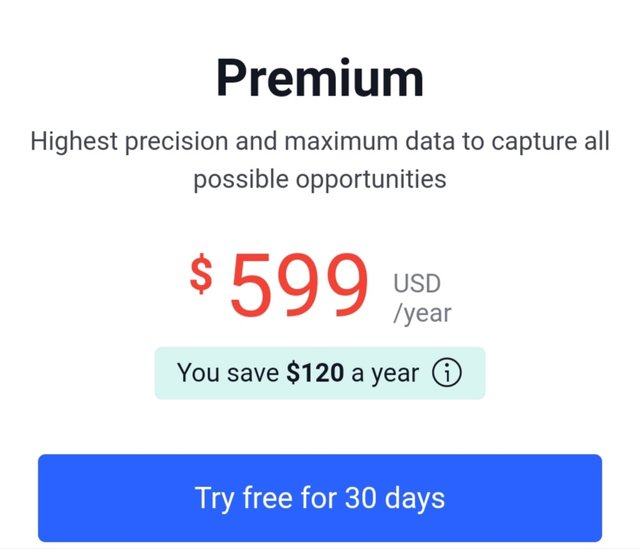
There are two kinds of upgrades that we can do, namely monthly and annually, and the payment options offered are varied, which I will explain below:
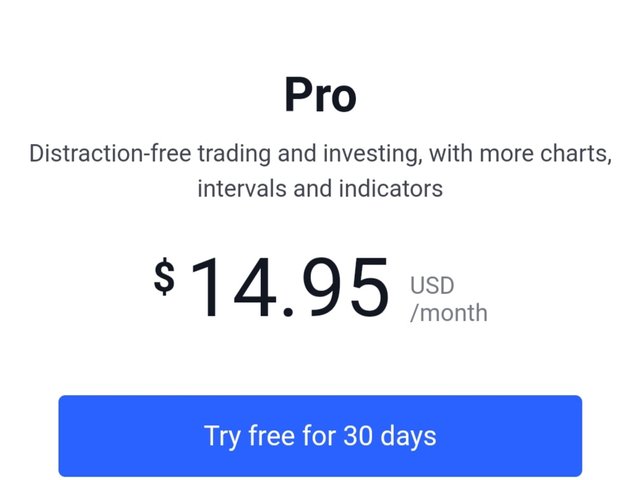
| 5 indicators per chart |
| 2 charts in one window |
| 20 server-side alerts |
| Ad-free |
| Volume profile indicators |
| Custom time intervals |
| Multiple enhanced watchlists |
| Bar replay on intraday bars |
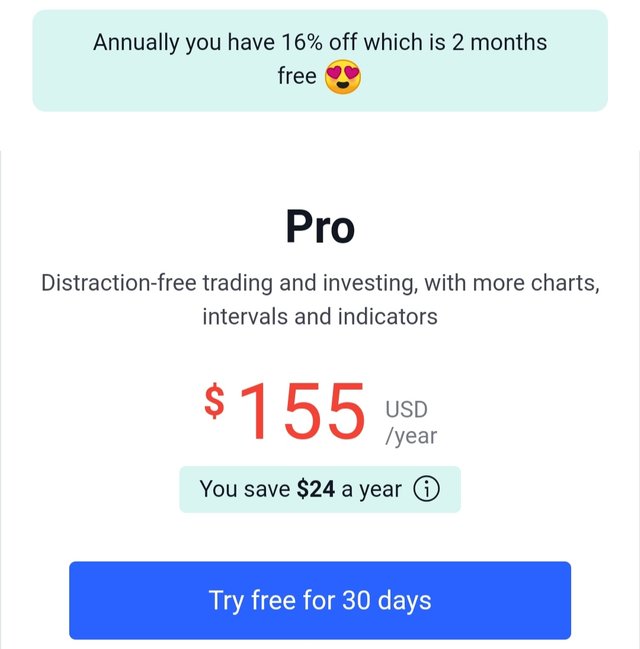
| 5 indicators per chart |
| 2 charts in one window |
| 20 server-side alerts |
| Ad-free |
| Volume profile indicators |
| Custom time intervals |
| Multiple enhanced watchlists |
| Bar replay on intraday bars |
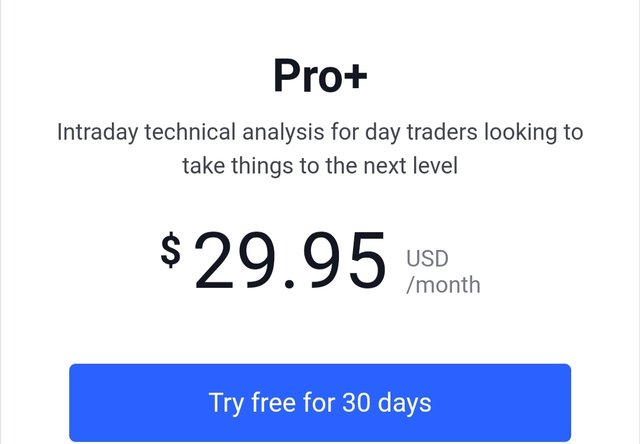
| 10 indicators per chart |
| 4 charts in one layout |
| 100 server-side alerts |
| 2 devices at the same time |
| Intraday exotic charts |
| Charts based on custom formulas |
| Chart data export |
| Indicators on indicators |
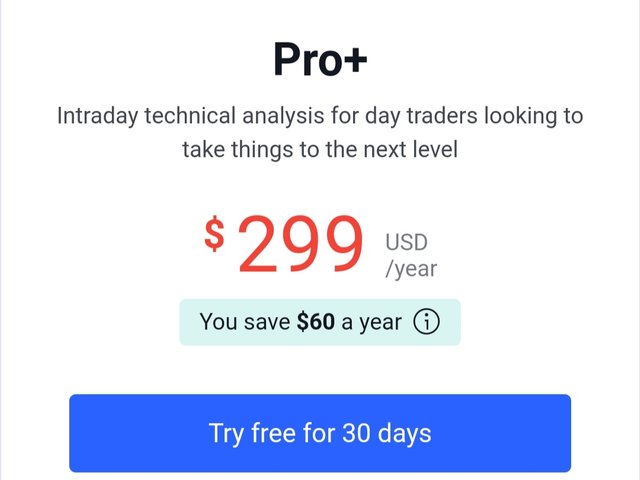
| 10 indicators per chart |
| 4 charts in one layout |
| 100 server-side alerts |
| 2 devices at the same time |
| Intraday exotic charts |
| Charts based on custom formulas |
| Chart data export |
| Indicators on indicators |
| 25 indicators per chart |
| 8 charts in one layout |
| 400 server-side alerts |
| 5 devices at the same time |
| Second-based intervals |
| Alerts that don't expire |
| 4x more data on charts (20K bars) |
| Publishing invite-only indicators |
| 25 indicators per chart |
| 8 charts in one layout |
| 400 server-side alerts |
| 5 devices at the same time |
| Second-based intervals |
| Alerts that don't expire |
| 4x more data on charts (20K bars) |
| Publishing invite-only indicators |
After registering an account and knowing the upgrade packages offered, we will now discuss the interesting features in TradingView. There are many features that are offered for us to use here, which I will explain below.

It can be seen that there are 5 features that we can use, namely Charts, Markets, Screeners, Community, and More. Next, let's describe one by one of these five features.
In the chart feature we can get information about various things in the chart, such as the current condition of the market circle and what items are available in the market. This Chart feature is very intuitive for beginners, but has everything an advanced investor would expect. Whether you just want to see the latest stock prices or analyze price motives with advanced scripts available here. But not all of that is provided in free mode, we must first choose a subscription package to find out more information provided by the chart.
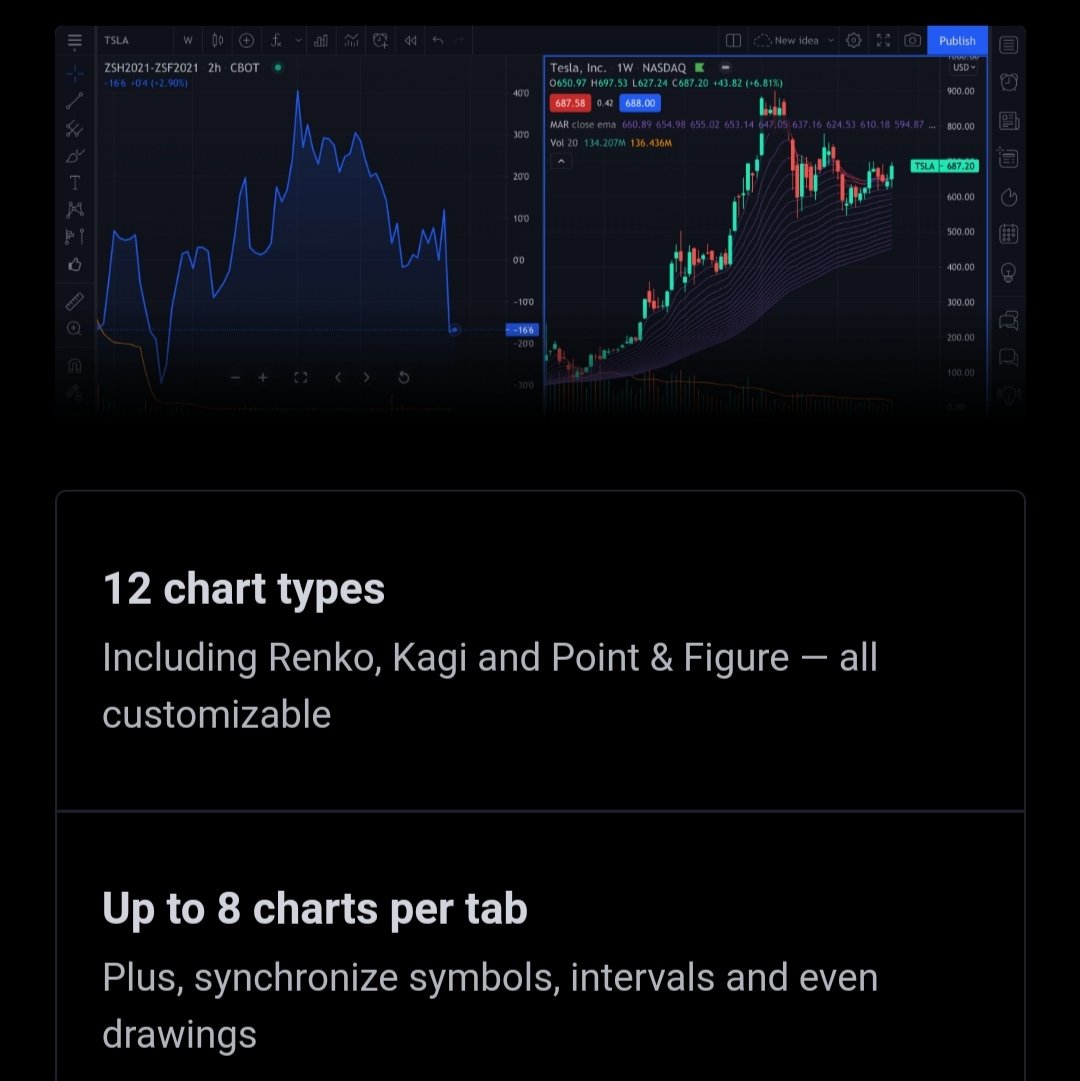
It provides 12 chart types, including Renko, Kagi and Point & Figure, all of which can be customized. In one tab can Up to 8 charts plus, synchronize symbols, intervals, and even images. We can also replay the market and view at the speed and resolution we want.

There are lots of tools on the charts provided by TravicView such as symbols, indicators, financials, templates, alerts, and others. We can also make settings such as changing the color of the body and lines that are displayed on the chart. In addition we can save, copy or copy the link and Tweet the chart image.

Here we can see the latest developments in global markets such as stocks, forex, cryptocurrencies, currencies, indices, futures, and bonds.

Because here we are talking about cryptocurrencies, we will focus on cryptocurrencies only. I think everyone here is familiar with cryptocurrencies, but this menu also briefly discusses cryptocurrencies, such as the screenshot below.
There are 6 tabs that we can explore here, namely overview, ideas, prices, DeFi coins, Market Cap, and DeFi Market Cap.
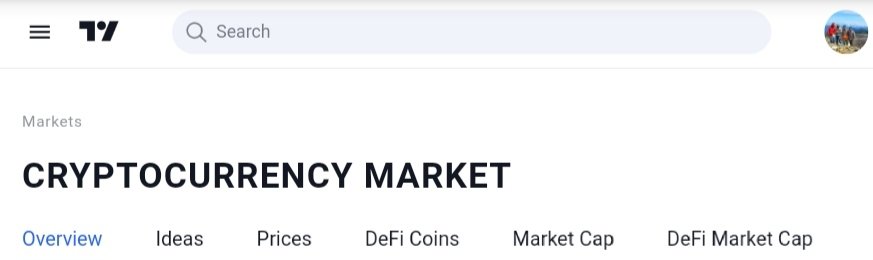
But here I only discuss the prices tab.

Here we can see the latest developments in the price of cryptocurrencies. More than 300 types of coins are presented here such as bitcoin, ethereum, tether, and others. The default setting shows prices in USD and sorts crypto assets by market cap.

Switch USD to BTC to see price comparisons in Bitcoin.

Shown here are key metrics such as closing price, total and number of coins available, volume traded, and percentage change in price.

Click the Performance tab to analyze volatility and evaluate the performance of a specific crypto asset by selecting different time periods.


On the Oscillators and Trend-Following tabs many technical indicators can help us determine the direction of the trend and see the current market situation.

Screeners function to screen stocks, forex and crypto that will be traded. Like a filter, of course, there are things that need to be shown and there are things that are not. There are 5 tabs in this screeners menu, which can be seen in the screenshot below.

Because we are in the Mini Crypto Program, so I will do a simple simulation on Crypto Screeners only.

After selecting the Crypto Screeners tab, I immediately chose to look at Trend-Following. Here we can see some cryptos that are good at selling and buying values.

Then, in the far right corner there is a filter tool provided to filter things such as exchange, market capitalization, volume and many more.

TradingView is like an association in the real world, a gathering place for all kinds of people who share the same interest in the global market, be it traders or investors.

The community here talks about many things about the global market including ideas, scripts, and more, we also watch learning through video streams here. Like most community features on various platforms, of course, the community here also aims to gather everyone to share their views on the global market.


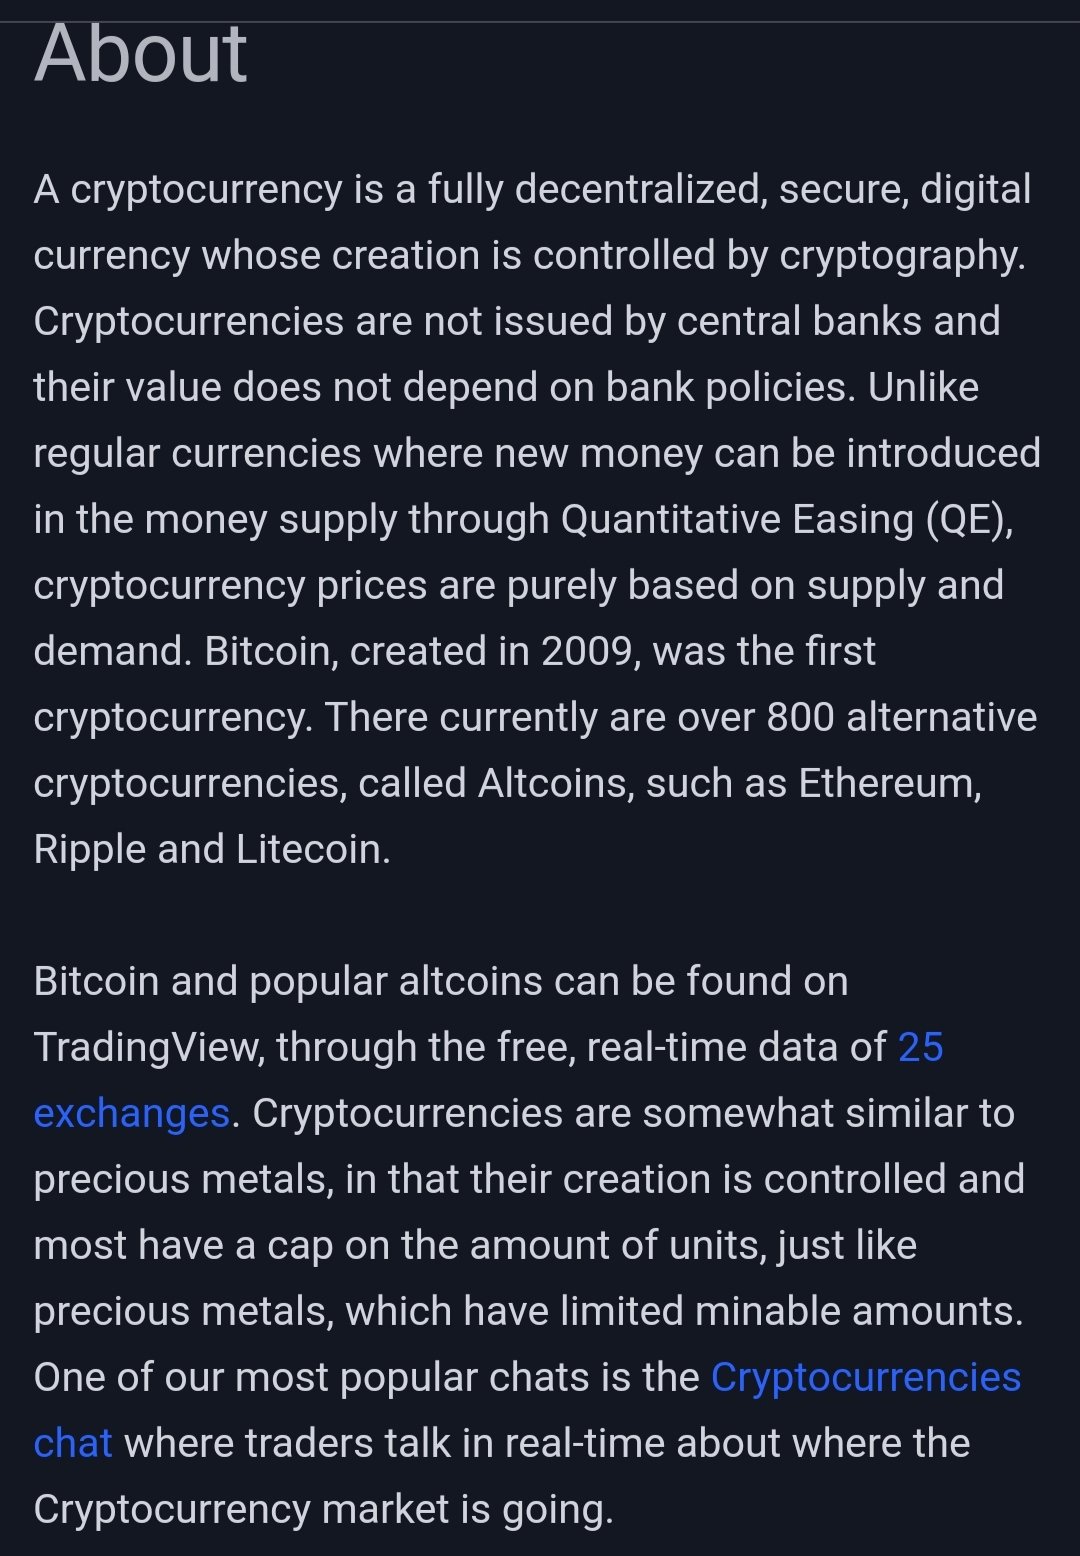
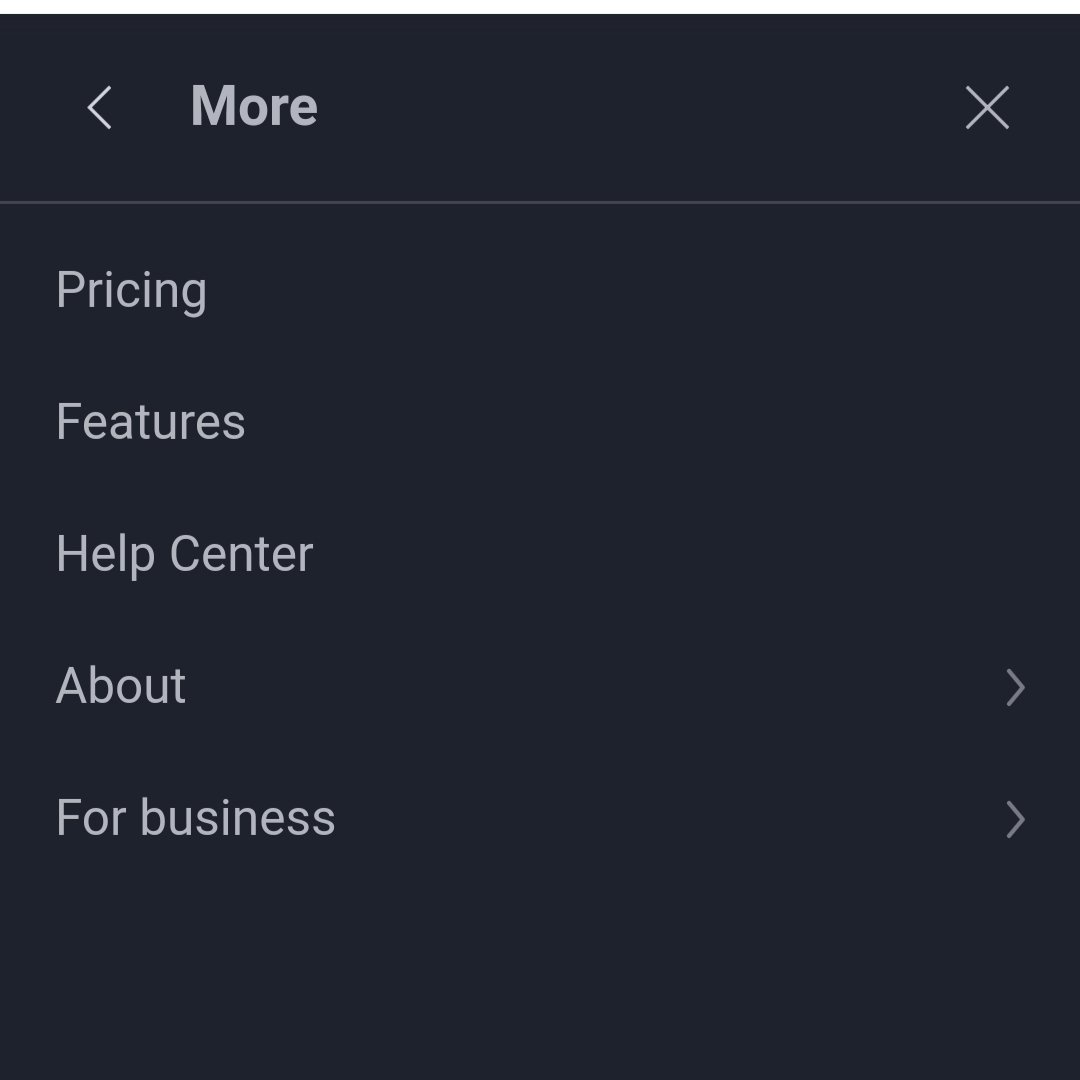
In the more menu we will be presented with some additional information that is also very important for traders and investors such as pricing, features, help center, about, and everything about Business.
Since it's more fun to use the mobile view than the desktop, I want to change the chart display to my liking. Starting from changing the theme to dark first, then changing the language into my National language. Then how can I do that? after fiddling with the graphic menu I finally understand how and I will share it with you guys. Go to the chart menu first so that a display like the one below appears.
Click the 3 lines in the left corner of the page so we can change the theme and language to our liking.

Switch the theme to dark by sliding the button to the side, the theme turns dark.


Activate the drawing panel so that we can edit the chart more freely.


The default language of this chart is English, we can change it to the language we want.

Then we return to the page and click the settings button, so that the display appears as follows.

Click on settings and set the display according to our taste. There are 6 things that we can set here such as symbols, scale, status line, appearance, trade and events.

I prefer a chart that is predominantly white and light blue, so I changed the body, border and wick colors to white and blue, on the symbols tab.


Then on the appearance tab I changed the background and added a watermark.

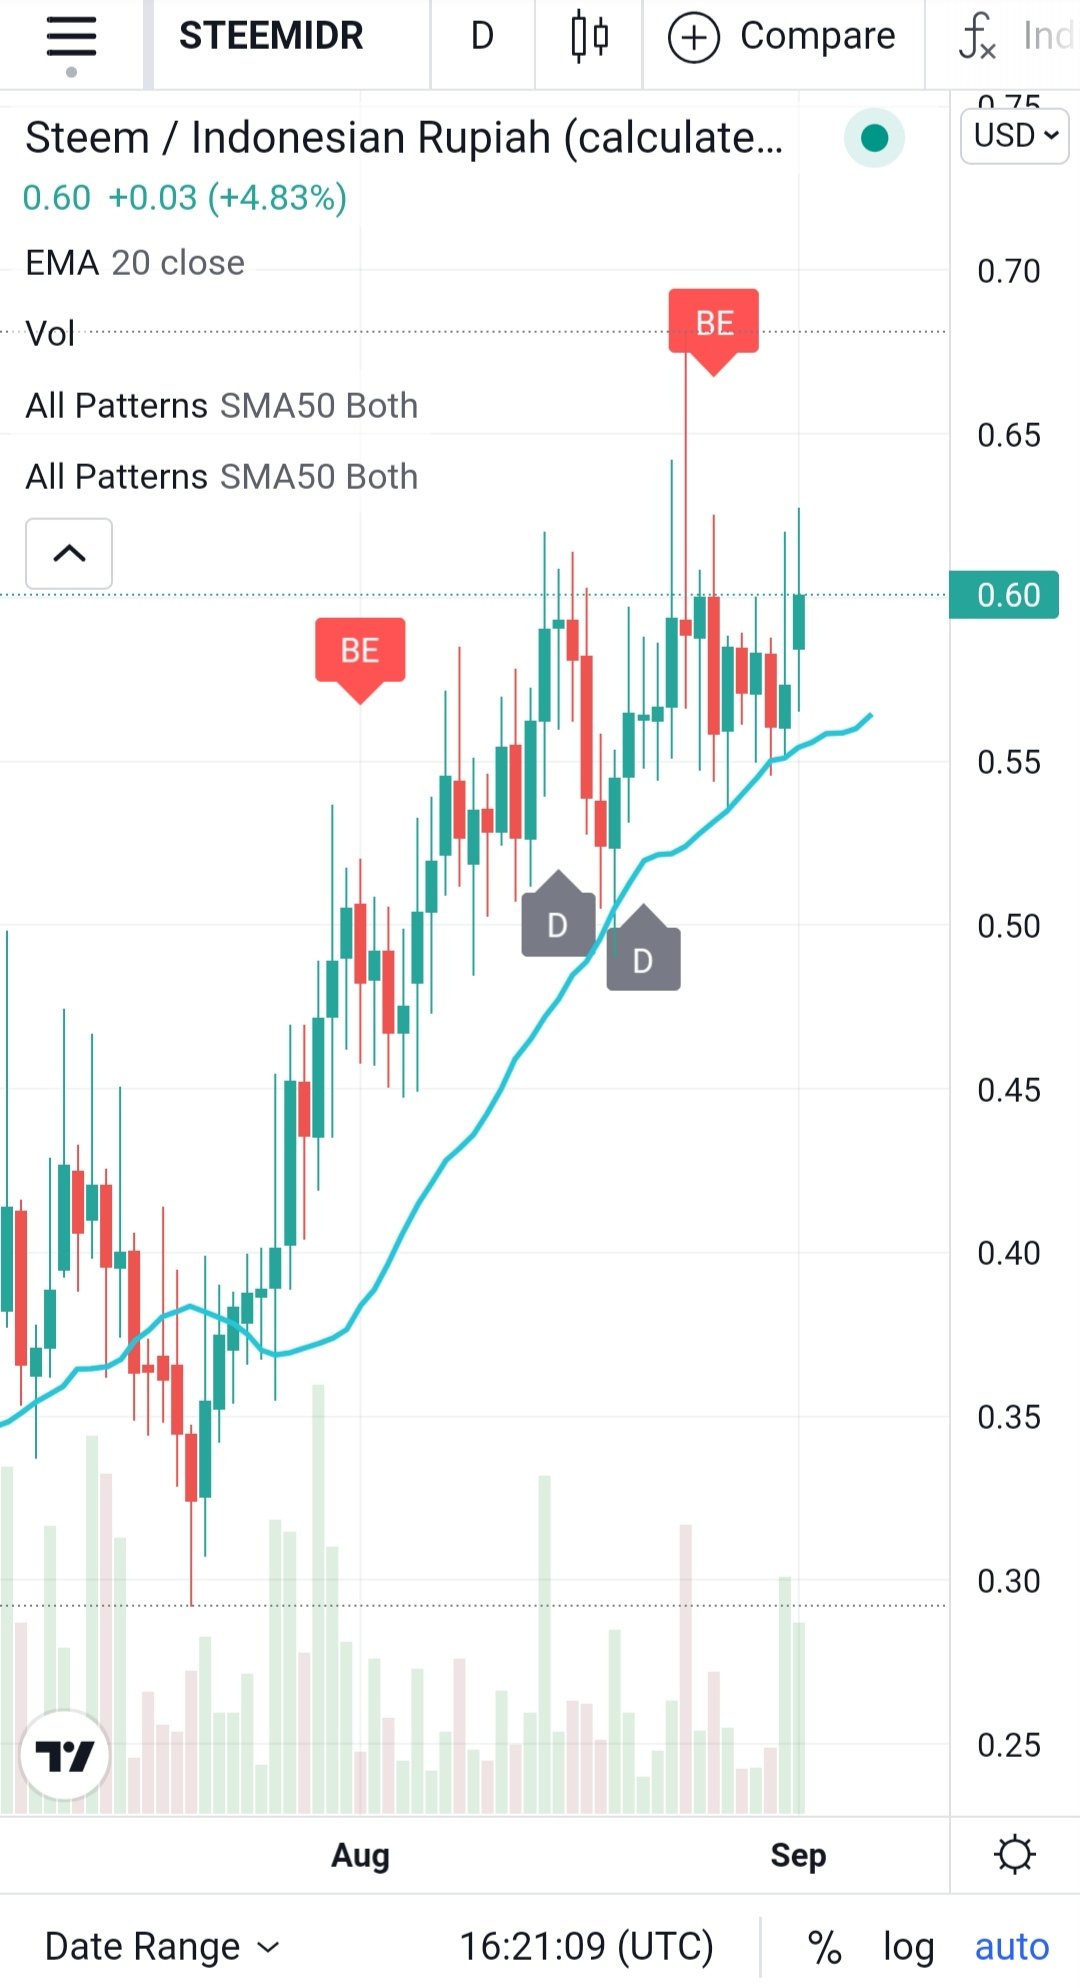
Click on the Indicator tab at the top of the chart, then several indicator options will appear as follows.

Select the indicator you want to add, for example Candlestick Patterns. Then select one of the indicators offered.

Since I haven't upgraded yet, I can't add Indicator freely.

If we want to get maximum results, we must subscribe to the package that has been provided, as I mentioned above.
Using TradingView is very helpful for both traders and investors, in understanding the market. For a new user like me, of course, this platform is very beneficial for me, because I can understand new ideas as well as old ones from the seniors here.
This platform does not only talk about cryptocurencies, but also stocks and forex, thereby increasing users' knowledge of all the things that are commonly traded in the global market.
Of course, this platform is very helpful for professional traders and investors, because the information on market cycles and market analysts provided here makes the market more predictable.
From the long description above, the conclusions are below:
TradingView is a social network of 30 million traders and investors who use the world's best charts and analytical tools to spot opportunities in global markets. TradingView also has an application that can be downloaded for free.
TradingView is a platform that provides information about global market developments such as market cycles, market analysis, and various other things about global markets such as stock price developments, forex and crypto.
Account registration on the TradingView site is very easy, and you can use our other social media accounts such as Google accounts. In addition, we can upgrade our account to Pro, Pro1, or premium by subscribing monthly or annually.
The features used also vary, such as charts, markers, screeners, community, and more. Especially for the chart we can edit the chart according to our wishes, and we can also add indicators as a tool to understand the chart.
TradingView is a new user friendly platform, so it didn't take me long to understand a little bit about how to use the platform. I recommend to my friends out there who want to pursue the global market field to immediately open this site or download the application.

That's my little understanding of how to register and operate an account on TradingView. Of course, there are still many mistakes and shortcomings in this homework post.
Thankyou once again to Cut Kak @liasteem for initiating this program, as well as @stem.education officials including bang @heriady, bang @irawandedy and bang @klien.civil.
I invite my brothers in TSS whose reputation is still below 60 @jun.imaginer @arieffadly88 @pieasant @omarkhayyam @hendrasusoh @bonbons @pujiaman @qhamal @daengmarwan and @ofansr to be part of the "Mini Crypto Program".

Mantap kali my bro....
Seketekeurlaleup my bro 😅😅
Alah, tapegah pe tapegah man... hayeeuuuu...🤣👏👏
Begitu lah kata para pujangga 😅😅
Mantap kali kanda.... 👍🏻👍🏻👍🏻
Siap bg..