Burnsteem25 : Zcash (ZEC) Price analyst for future trading #29
Hello, welcome back, friends, to the most complete technical analysis blog in this steemit community. With me, Jerry Madez. This time I will analyze a coin that is fundamentally good and is also included in the list of coins that last a long time in the market, Yup this time we will analyze Zcash or ZEC, coins that carry private transactions such as Monero. So without further ado, let's get into the analysis.
Halo, selamat datang kembali kawan, di blog analisis teknikal terlengkap di komunitas steemit ini. Bersama saya Jerry Madez. Kali ini saya akan menganalisa sebuah koin yang secara fundamental bagus dan juga termasuk dalam daftar koin yang bertahan lama di pasaran, Yup kali ini kita akan menganalisa Zcash atau ZEC, koin yang membawa transaksi private seperti Monero. Jadi tanpa basa-basi lagi, mari kita masuk ke analisis.
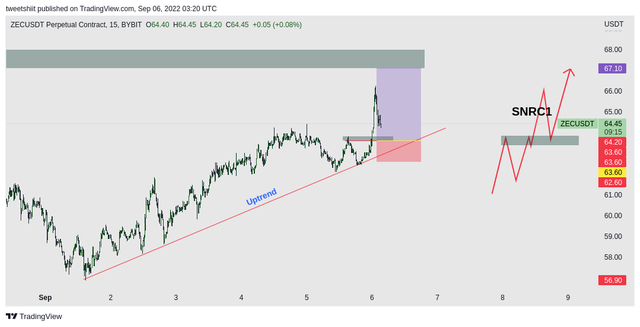
OK, friends, there is a straight trendline that indicates that ZEC is experiencing a price increase in the 15m time frame. And next to it, I gave a picture of the SNRC1 pattern, and it is clearly visible on the zec price in the 15m time frame there is SNRC1. And this is a continuation pattern, or price continuation pattern, and it is seen that "ZEC" is experiencing a clear upward trend.
Oke teman teman terlihat ada trendline yang lurus terlihat yang menandakan bahwa ZEC, sedang mengalami kenaikan harga pada time frame 15m. Dan disebelahnya saya berikan gambar pola SNRC1, dan itu telihat jelas pada harga zec di time frame 15m terdapt SNRC1. Dan ini adalah pola lanjutan atau pola penerusan harga, dan dilihat bahwa ZEC mengalami trend kenaikan yang jelas.
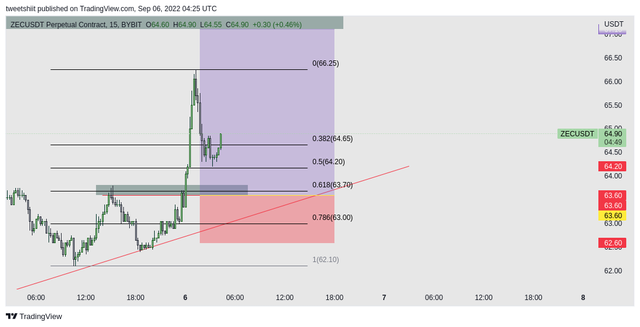
Another reason why I entered in the gray box that I marked apart from the SNRC1 is that there is a price correction usually in the golden Fibonacci area, which is usually in the 0.50 and 0.618 areas. This area is a retracement area that becomes a foothold if it succeeds in bouncing the price from that area. It will usually continue the price towards the previous high or even higher.
Alasan lain yang membuat saya kenapa saya entry di grey box yang saya tandai selain dari adanya SNRC1 adalah, karena adanya korektif harga biasanya pada area golden fibonacci yang biasanya di area 0.50 dan 0.618. Area tersebut merupakan area retracement yang menjadi pijakan apabila berhasil memantulkan harga dari area tersebut maka, biasanya akan melanjutkan harga ke arah tertinggi sebelumnya atau malah lebih tinggi.
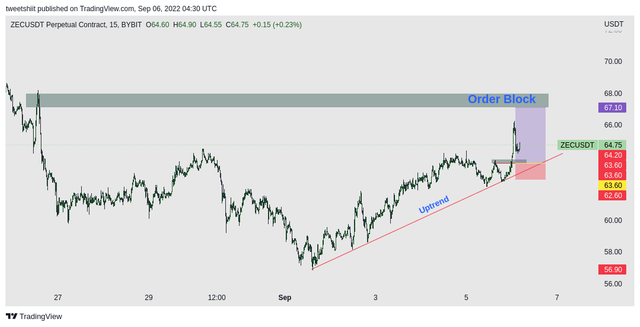
As for the take profit area, I take the zone area that has strong selling pressure, which is usually marked with a block order. And that area becomes a good area for us to release positions, as well as see if the area can be a good short position area, be penetrated, or be used as a new entry area later in a buying position.
Sedangkan untuk area take profit saya mngambil area zona yang menjadi selling presure yang kuat, yang biasanya ditandai dengan order block. Dan area tersebut menjadi area yang bagus untuk kita melepas posisi, sekaligus juga melihat apakah area tersebut bisa jadi area short posisi yang bagus atau akan tertembus atau bisa dijadikan area entry baru nantinya pada posisi pembelian.
Okay, for the details, enter the stop loss and target as shown below.
Oke untuk detail entry, stoploss dan target sesuai dengan yang dibawah ini.
Entry : 63.60$
Stoploss : 62.60$
Take profit : 67.10$
Keep in mind that my analysis is specifically for the derivative market, but if it is used for the spot market, I don't recommend it this time, because the take profit distance is only 5,5% of the price movement.
Perlu diingat analisa saya ini saya khususkan untuk derivatif market, namun apabila dipakai untuk spot market saya kurang menayarankan kali ini, karena jarak take profit cuma 5,5% saja dari pergerakan harga.
REMINDER
Even though the analysis that we find provides many signals and confirmations, it must be remembered to manage trading risks. I don't get bored, I always remind you this is very important and crucial when we trade in the futures market. Risk, risk, and risk. So use 1% of your total equity to be at risk if this analysis fails, so that when we fail, we only lose 1% of our capital gain. And for rewards, I see there is a potential reward from this 1 : 3.5 analysis, and this is very good.
Meskipun analisa yang kita temukan banyak memberikan signal dan konfirmasi, tetap harus di ingat untuk melakukan managing resiko trading, tak bosan bosan saya selalu ingatkan hal ini karena hal ini sangat penting dan krusial apabila kita melakukan trading pada future market. Resiko, resiko dan resiko. So gunakanlah 1% dari total equity kalian untuk menjadi resiko apabila analisa ini gagal agar ketika mengalami kegagalan kita cuma kehilangan 1% saja dari kapital gain nya kita. Dan untuk Reward, saya melihat ada potensi reward dari analisa ini 1 : 3.5, dan ini sangat bagus.
Okay, that's all from me. Thank you to friends who have taken the time to read this article. Oh yes. For data analysis, I take the data from the chart Bybit.
Oke sekian dari saya, terimakasih kepada teman teman yang sudah meluangkan waktu untuk membaca artikel ini, oh ya. Untuk data analisa data saya mengambil dari chart Bybit.
And also for admins and moderators. @steem-database I hope that this post on technical analysis can help friends in this community learn about the crypto futures market, as well as serve as a means of sharing analysis and, hopefully, be useful.
Dan juga untuk admin dan moderator @steem-database semoga tulisan saya ini mengenai teknikal analisa bisa membantu teman teman di komunitas ini dalam belajar future market crypto dan juga sebagai sharing analisa dan semoga bermanfaat.
The reward from this article will be donated 25% to @null for the development of the Steemit community.
Thank you for sharing posts, improve the quality of your posts and stay original.
Have a nice day !