Steem Watcher Development || Data Visualization using chart.js || 06-April-2023
.png)
Hello Steemians!
How are you all, I hope you will be good, by the grace of God, I am also well. Today I am here with new development on steemwatcher.com that I have done recently. In this week, I have done my work to add new features of different types of charts to see the overview of weekly and daily base reports. After this development, we will be able to see the overview of over reports. We can categories the whole reports on the base of plagiarism types. It is very necessary to inspect the working behavior of detectives.
with this feature, we will achieve the concept of data visualization. There are different types of charts that i have add in this development phase.
- Pie Chart
- Line Chart
- Bar Chart
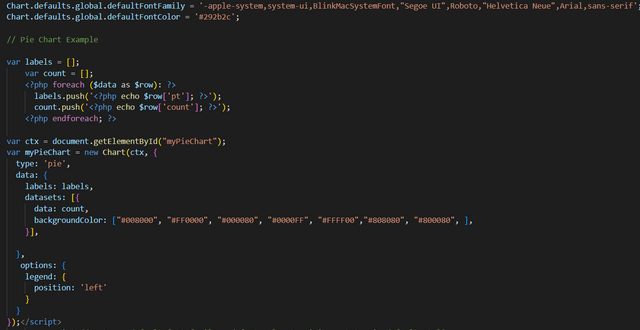
Pie chart will help to count the reports of detectives on the base of its plagiarism types. Complex data will categories very easily with pie chart data visualization. After inspecting this chart, we will be able to ensure that what type of plagiarisms are trending on steemit. Then we can make decisions on it. Here is the UI design of pie chart.
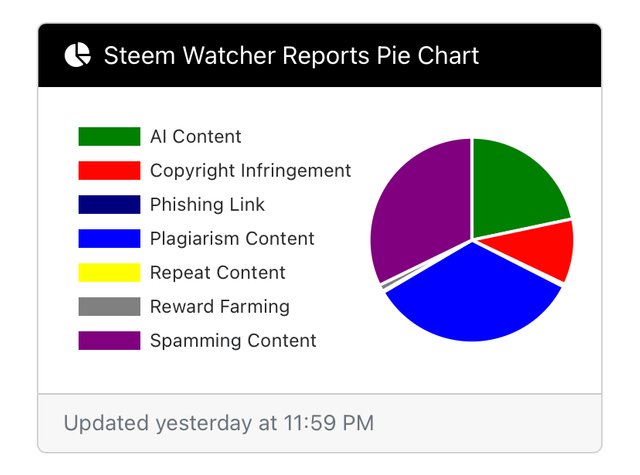
It is design with the help of SQL and JavaScript.
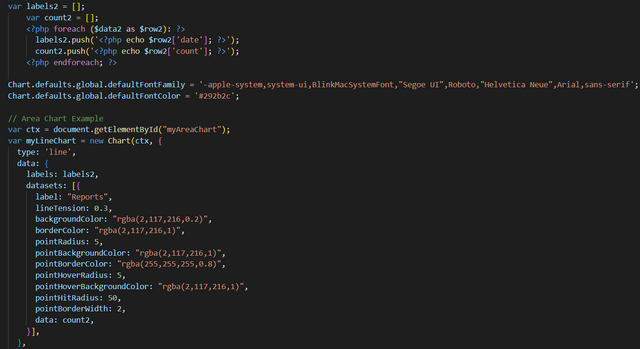
Now we move on second chart that is line chart. It is necessary to make due to inspection the daily routine wise abuse reports. With this feature, we can see the plagiarism activity on daily base. Here is the UI design of line chart.
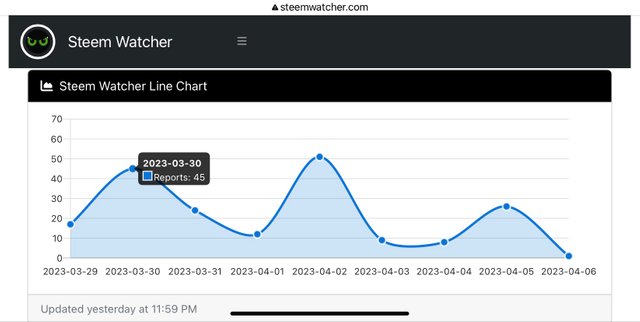
It is achieved by using SQL and JavaScript language
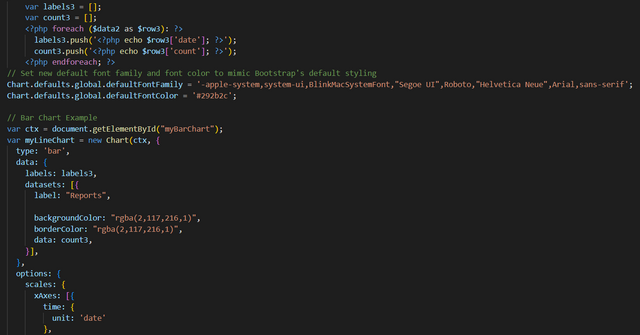
Bar chart is very common and easy to use for data visualisation. At that time it is working on daily base, but I will modify it on weekly base. It will provide the one candle stick after every week. With this chart we will able and assume that how much we have control on plagiarism activity. Here is the screenshot of its UI design.
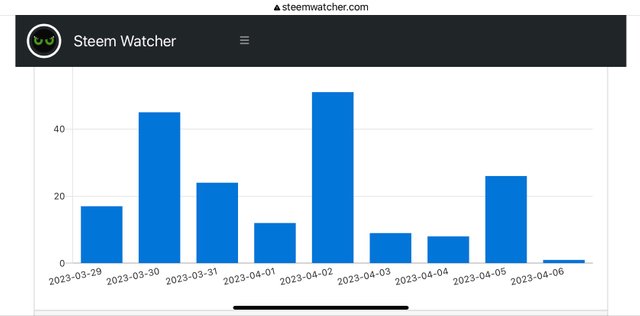
The backend implementation of this chart is base on SQL and JavaScript.
SQL is the core language to store and get the data from database. I took data from data base on the base of date condition. HTML, CSS languages are used for front-end development, JAVASCRIPT and PHP are used for back-end development. If you have any questions about this development. We can feel free to ask any question.

If anyone have any suggestion, then must share with us in the comment section. we will focus on it and try to apply it if it will suitable.
Here is the Link of official Steemwatcher.
www.steemwatcher.com
Special Thanks to
Cc: @rme
Cc: @blacks
Cc: @steemchiller
Cc: @hungry-griffin
Cc: @stephenkendal
Cc: @steemcurator01
Thanks for giving your precious time to my post.
Follow | Upvote | Share | Comments
Follow me on Instagram.
Instagram
🆃🅷🅰️🅽🅺 🆈🅾️🆄
This post has been featured in the latest edition of Steem News...
If you would like to support Steem News please consider voting for @pennsif.witness
Hello Bountyking.... Heartly congratulations on your succes jn steemit.
I am struggling at present , only you can help me to grow on my post. Please upvote me and I will also upvote you back. Please help me.