Golden Cross And Death Cross
What is a golden cross?
A golden cross, or golden crossover, is a chart pattern marked by a short-term moving average surpassing a long-term moving average. Traditionally, the 50-day MA signifies the short-term average, and the 200-day MA represents the long-term average. However, this pattern is not confined to specific time frames and revolves around the fundamental concept of a short-term average intersecting a long-term one.
Typically unfolding in three stages:
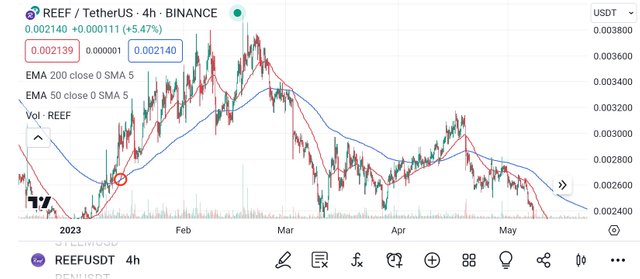
The short-term MA lies below the long-term MA during a downtrend.
The trend reverses as the short-term MA crosses above the long-term MA.
An uptrend commences, characterized by the short-term MA consistently staying above the long-term MA. Illustrating a golden cross signaling a new uptrend in crypto.
What is a death cross?
A death cross serves as the antithesis to a golden cross, representing a chart pattern where a short-term moving average descends below a long-term moving average. For instance, when the 50-day MA crosses beneath the 200-day MA it happens. This scenario is generally perceived as a bearish signal.
Typically evolving in three stages:
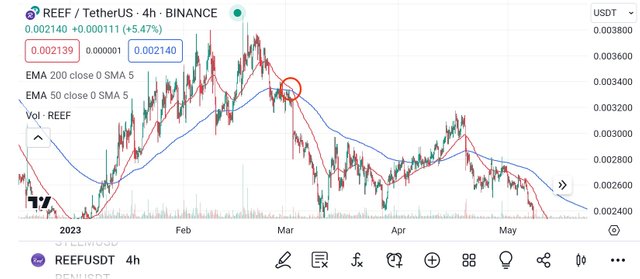
The short-term MA resides above the long-term MA during an uptrend.
The trend undergoes a reversal, marked by the short-term MA crossing below the long-term MA.
A downtrend ensues, characterized by the short-term MA consistently staying beneath the long-term MA. Illustrating a death cross confirming a downtrend in crypto.
Golden cross vs. death cross - what’s the difference?
After analysing both concepts, we seen that their distinction becomes evident as they represent total opposites. While the golden cross tends to be viewed as a bullish signal, indicating a potential uptrend, while the death cross is considered as a bearish signal, signaling a potential downtrend.
And confirmation for both crosses often involves elevated trading volume. But we can suse other indicators to examine within the crossover context, such as the Moving Average Convergence Divergence (MACD) and the Relative Strength Index (RSI).
Well, It's also crucial to note that moving averages, serving as lagging indicators, which lacks predictive power so both crossovers typically offer strong confirmation of a trend reversal that has already occurred, rather than signaling one in progress.
https://twitter.com/SibanandaMaha14/status/1733193803056709989?t=xZVRJH_BpEvTK5oYSBgSyw&s=19