Multi-timeframe Analysis Of APEUSDT On Trading View, Using Indicator As Confluence
My crypto family,
How are you all doing today,
I hope you are all doing perfectly fine, I am here today to share my interesting analysis with you all on APEUSDT.
Ape token is a good token with convincing fundamentals and as such, I decided to do a technical analysis of it, using it's historical price data.
As my analysis always come, I begin from the higher timeframe and head straight to the lower timeframe, and I do this inorder to get the overall trend of the market.
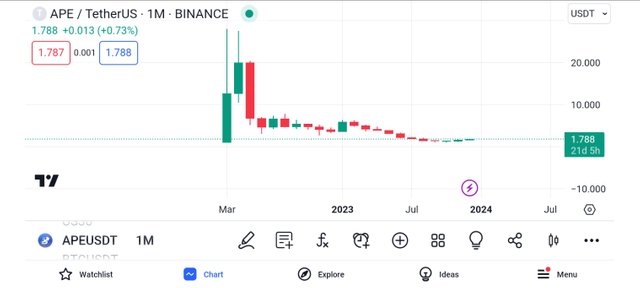
I started my analysis from the monthly timeframe, and from this, I couldn't get any unique information from the market, and as such, I decided to move to a lower timeframe.
Moving to a lower time frame will give me some more candlestick that contains more market activities, and this will help me to conduct a more effective market analysis.
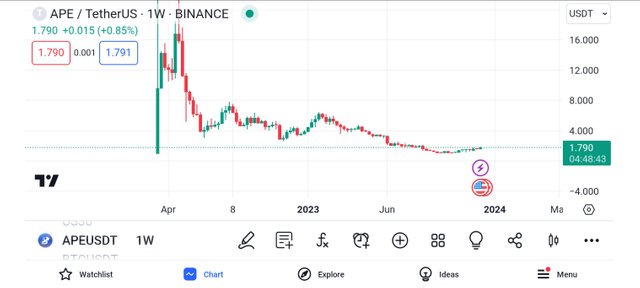
Moving to the weekly time frame, I saw more candlestick as I expected.
The more the candlestick, the more the market activities a user can access, then with this information, i could mark out some key regions which is what I did in the chart below.
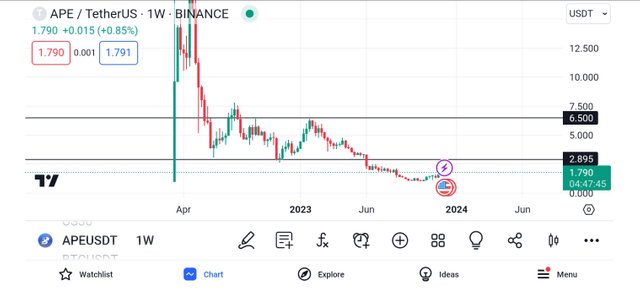
From my chart, it is seen that I have marked out key levels in the market.
I have marked out my support and resistance levels, and these are valid levels because they have been tested and respected severally by price in the market.
As shown above, whenever the market touches this key region, it gets rejected and thus moves in the other direction.
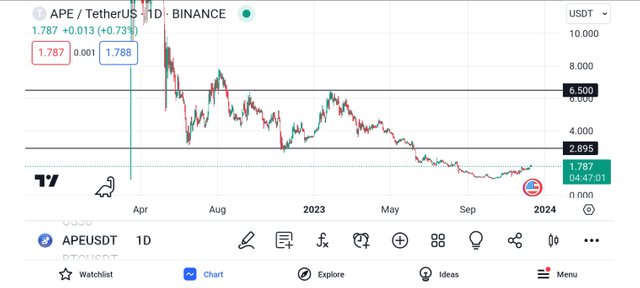
Moving to the daily timeframe, I could see more detailed information about the market.
I have seen levels that has been respected severally by the price, and I have seen levels that have been violated by price.
This historical details have given me a clue on which levels are valid and which are invalid, and this will help to shape my trading decisions.
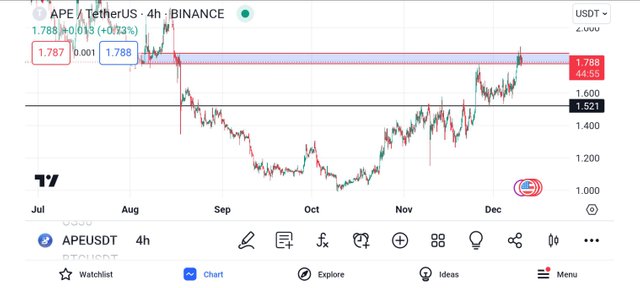
Moving to the lower timeframe which is the 4hr timeframe, I had to zoom inorder to trade within the current market range.
When I zoomed in, I noticed some key levels within this new range of the market, then I spotted out this levels just as seen above.
Then I could see a rejection candle on the Support level of this range, and this is inline with my analysis, then I moved a bit lower for more confirmation.
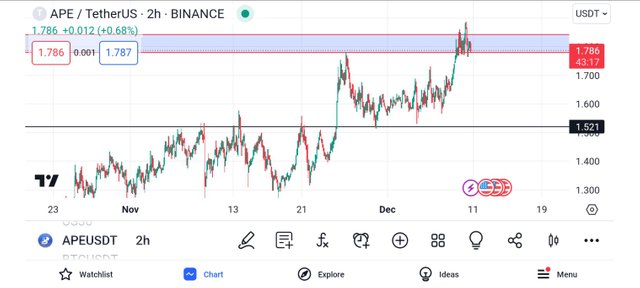
On the 2hr timeframe, I could see several rejection candles , and this is in confluence with my bearish bias.
As I have always said, the support and resistance strategy produces a more effective result when it is combined with other technical tools.
Then I added my technical Indicator for confluence to my trade.

We are all familiar with the activities of the stochastic indicator, it helps to detect overbought and oversold region of the market.
When it approaches the 80% line, it is in an overbought region and when it approaches its 20% line, it is in an oversold region.
From the above screenshot, we can see that the market is in an overbought region and this is a bearish trend reversal signal.
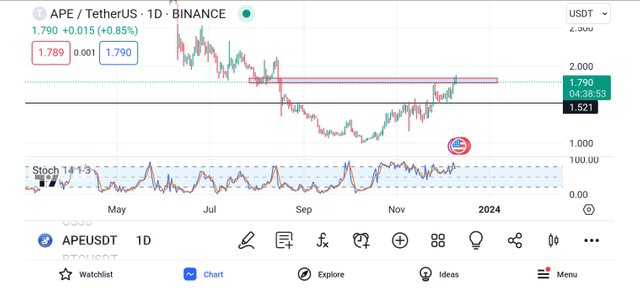
Then I moved lower to the daily timeframe to understand the analysis of the stochastic indicator.
When I applied my stochastic indicator, I noticed the market is in an overbought region, and this is a bearish trend reversal signal,and I took this as a confluence for my trade.
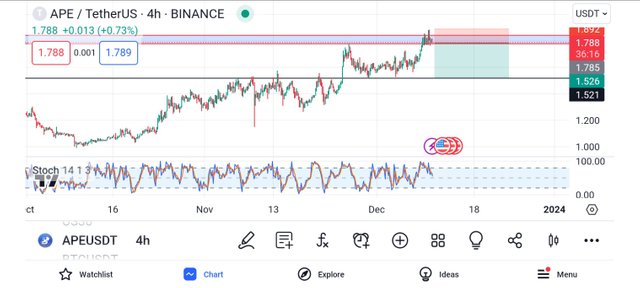
Then i moved to the 4hr Timeframe to search for my entry.
Having watched the market thoroughly, I placed a short position on the resistance level, placed my take profit on the closest support in the market, and my stop-loss above the resistance level.
Conclusion
Explained below is my personal analysis on the price APEUSDT on several timeframe.
The above information should not be used as a financial advise, rather it was made for educational purposes.
https://twitter.com/starrchriz/status/1733950056888189145?t=y3aIMcqy1FhKSDK1Wyoj6g&s=19
Dear @starrchris ,
We appreciate your active participation and contributions to our community. To ensure a positive environment for all members, we have implemented a set of guidelines to maintain respectful and constructive discussions while upholding community guidelines.
This is an interesting post you have shared on your analysis of aptusdt.
Keep sharing quality post in the community
Now Engage, Connect, and Inspire Each Other to Reach New heights.
Thank You.