Understanding the difference between Golden cross and death cross in moving average
Hello Steemians,
It's another day to improve our knowledge based on technical analysis. As a Steemian, it is important we understand how the market operates especially now that we have our dear Steem token listed on future trades in most exchanges.
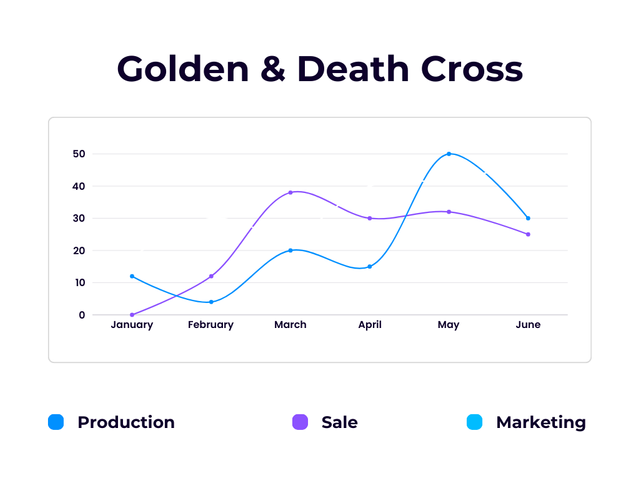
Background image Edited on Canvas
I never taught of learning trading until I became a Steemian. Blogging is not enough to give you the knowledge you need about the movement of cryptocurrency and that is why trading assets using future or spot is very essential to all of us.
Today I feel it will be good if we look indepth on two different crosses that always take place when using the moving average indicator. Recall that a few days ago I explained to us what and how moving average can be calculated.
For those who don't have the idea of what moving average is, I recommend you read through my previous article on this topic from my blog. As a summary, moving average is a technical tool used to determine the movement of the asset at any point in time.
There are different types of moving averages such as the simple moving average (SMA), Exponential moving average (EMA) which was the type of moving averages I discussed in my previous post about the moving average indicator. There are many other types of moving averages but we will get to know them with time.
One of the major characteristics of the moving average is that it is made up of two lines, one with small number of days or timeframe and the other with higher number of days or timeframe. So what these lines do to give users signals to buy or sell is that the cross each other and that is what brings about the golden Cross and the death cross.
Now let's see them one after the other in a more detail with a screenshot illustration so that we can better understand and also make use of it when we have the opportunity.

| Golden Cross in Moving Average |
|---|
If you apply a moving average to your chart and these moving average are two different lines, like the one in the screenshot below. Here we have the blue 💙 and the green 💚 lines. From the screenshot you will notice that blue EMA is 50 days whereas the green EMA is 200 days.
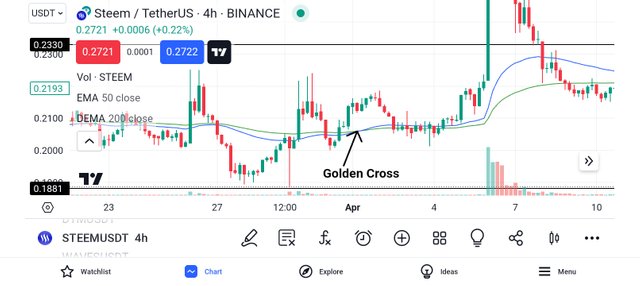
In golden Cross when the line with the lower number cross and is seen above the line with the larger number then we will say a golden Cross has taken place.
From the chart above, you will notice that the blue EMA line crossed and is seen moving above the green EMA line which is higher than it. Ideally when this happens, you will notice a change in trend from bearish to bullish.
In summary golden Cross means that the trend is changing or has changed to a bullish trend. Here you can see that the market is moving in an upward direction and this is an indication that the trend has changed and every good trader who wish to make profit will immediately long the market.
To place a buy order from such a market, you have to wait for the closure of the last candle after the golden Cross then you can place your buy order and your stop loss should be placed below the last candle that closed in this way you will be able to minimise loss and maximise profit.
The screenshot above shows how I placed a buy order after seening the goldilen cross on the chart. You can see how far the market moved after worth. You should always be close to the market to opt out after you make some profit if you didn't place a take profit.
| Death Cross in Moving Average |
|---|
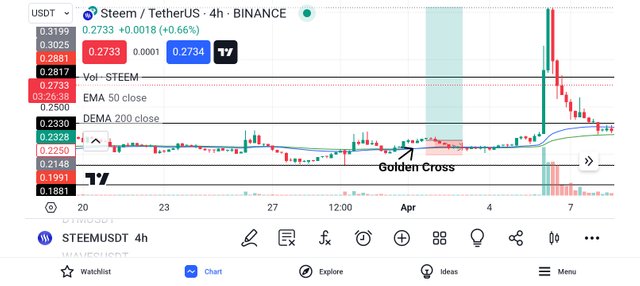
Similarly, If you apply a moving average to your chart and these moving average are two different lines, like the one in the screenshot below. Here we also have the blue 💙 and the green 💚 lines. From the screenshot you will notice that blue EMA is 50 days whereas the green EMA is 200 days.
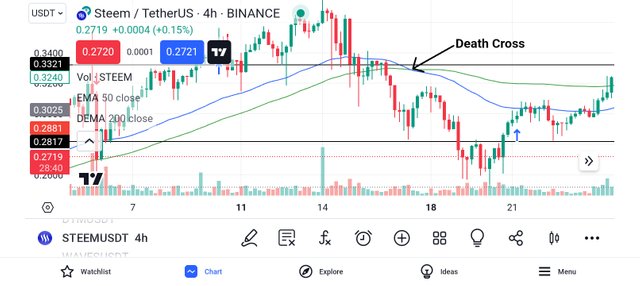
In death Cross when the line with the lower number cross and is seen below the line with the larger number then we will say a death Cross has taken place.
From the chart above, you will notice that the blue EMA line crossed and is seen moving below the green EMA line which is higher than it. Ideally when this happens, you will notice a change in trend from bullish to bearish.
In summary death Cross means that the trend is changing or has changed to a bearish trend. Here you can see that the market is moving in a downward direction and this is an indication that the trend has changed and every good trader who wish to make profit will immediately short the market.
To place a sell order from such a market, you have to wait for the closure of the last candle after the death Cross then you can place your sell order and your stop loss should be placed below the last candle that closed in this way you will be able to minimise loss and maximise profit.
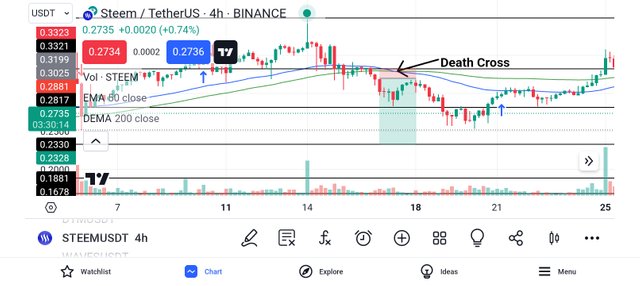
The screenshot above shows how I placed a sell order after seening the death cross on the chart. You can see how far the market moved after worth. You should always be close to the market to opt out after you make some profit if you didn't place a take profit.
Both golden Cross and death cross are two most important crosses that we see in our crypto chart. When these crosses take place, we either go long or short depending on which takes place. Golden Cross implies market going bullish whereas death Cross implies market going bearish.
These indicators doesn't only tells us about the change of trend but it also educate us on why to enter and exit the market. So we all need to get familiar with this indicator in other to minimise our losses and maximise our profit.
Finally, I want to thank you all for reading through my post today. If you have any questions or contributions, please do well to use the comment section of this post. See you all in my next publication.
Disclaimer: This post is made as an education and not investment advice. Digital asset prices are subject to change. All forms of crypto investment have a high risk. I am not a financial advisor, before jumping to any conclusions in this matter please do your research and consult a financial advisor.
NB: All images except otherwise stated are mine and taken from the TradingView website.
https://twitter.com/xavierf14044615/status/1797249609326116934?t=siW6rZlX4sRu_0kDKo6P2g&s=19
Very common topic, try to write some unique topic.
Thank you sir,I appreciate the tutorial.
Hoping to understand better,how to trade after your subsequent posts.