Understanding Crypto Charting | Trading Crypto with Aroon Indicator (Part 3)
The past two days have been an intensive tutorial on the Aroon indicator. If you have missed Part 1 and Part 2 of the tutorial, kindly click on the links Part 1 and Part 2 to have a complete guide and understanding today's topic.
I want to round up the tutorial about the Aroon indicator today and that is why I will be discussing more things that may be possible questions arising from the hearts of many at the moment.
I was also supposed to illustrate a demo trade of the indicator but because of lack of time and not wanting to put in too much at once, I will be skipping that part. The knowledge I have shared will go a long way in helping perform your analysis and demo trade to obtain a suitable result. Let's get started with Part 3.
| Understanding Aroon Oscillator? How does it work? |
|---|
As we have discussed in Part 1 of this tutorial, we established that the Aroon indicator came into the limelight in the year 1995 by a man known as Tushar Chande. We also established that the indicator is a trend-based indicator which helps to identify the direction of the trend and also the strength of the trend.
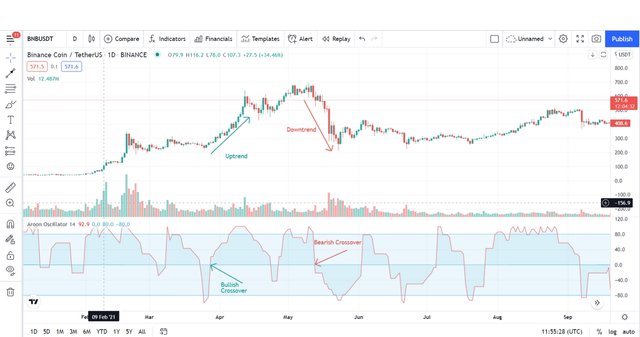
The Aroon Oscillator is made up of one line which oscillates between the values of -100 - 100. This line moves up and down depending on the market trend. When the oscillator goes to the positive value it implies that the market is in its bullish trend or uptrend whereas when the oscillator goes to the negative value it implies that the market is in its bearish trend or downtrend.
Crossover happens at point 0. When the oscillator moves to this point, then we can be able to predict if the market will reverse in another direction or if it will continue in the same direction. From the image below, we can see the Aroon Oscillator showing bullish and bearish crossovers. I have also marked the points on the chart for more clarification.
Just like the Aroon Indicator, the Aroon oscillator has the same properties. That being said, we can conclude that the difference between Aroon-Up and Aroon-Down lines is what gives us the Aroon Oscillator. For more clarity, let's look at the formula below.
Aroon Oscillator = Aroon Up - Aroon Down
It is important to mention here that the Aroon Oscillator just like the Aroon Indicator comes with a default length or period of 14 which is also subject to modification and to use it properly it is always recommended to give them the same setting when using them together. For this example, I have used a setting of 25 periods for both.
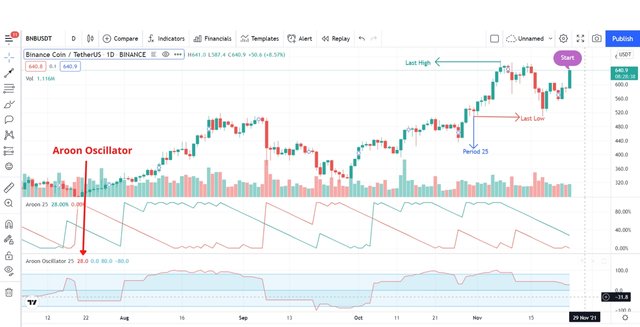
Aroon-up = 28
Aroon-Down = 0
Aroon Oscillator = Aroon Up - Aroon Down
= 28 - 0
= 28 (as indicated above)
| Does Aroon Indicator give False and Late signals? Explain. Show false and late signals of the Aroon Indicator on the chart |
|---|
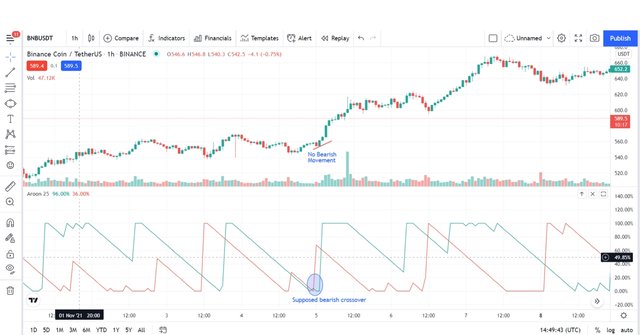
No indicator is perfect and the Aroon indicator is not an exception. Every indicator gives some level of a false signal. When we talk about false signals, we are referring to a situation where the indicator shows a different trend whereas the market acts differently. For instance, the indicator says the trend will reverse but instead of reversing the market continues in its direction.
This may result in many losses for those who followed the signal of the indicator at that moment. From the chart below, we can see that the Aroon-Down crossed the Aroon-Up in an upward direction. When this happens, it is supposed to imply a bearish trend taken over the market but this didn't happen hence it has misled all those that follow the signal.
Similarly, in the case of a late signal, it happens when the trend has already started before the indicator confirms its movement. Here the issue is that traders don't have the best chance to enter the trade from the beginning. This means they may have lost some other profit they were supposed to initially gain.
Let's consider the image below. From the image below, you will notice the Aroon-Up crossing the Aroon-Down in an upwards direction which indicates a bullish trend or an uptrend. This bullish trend is a sign to enter the market and place a buy order. It is correct but those who enter the market at this point may not make enough profit as those who entered earlier.
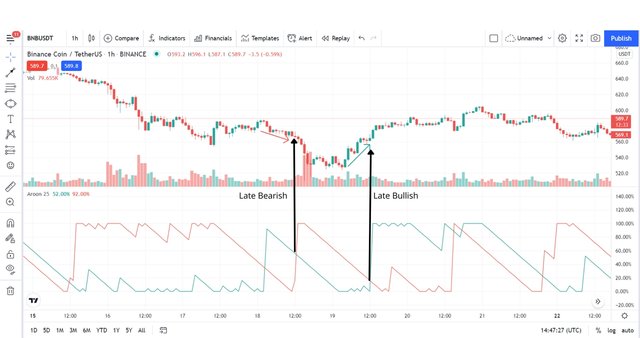
So that is a late signal from the indicator. In the same way, Aroon-down crosses the Aroon-up in an upwards direction which indicates a bearish trend or a downtrend. This bearish trend is a sign to enter the market and place a sell order. It is correct but those who enter the market at this point may not make enough profit as those who entered earlier.
| Explain the Aroon Indicator movement in Range Markets |
|---|
When we talk about a market in range, we are referring to a market that is not either a bullish or bearish trend this means that no notable trend is associated with the market at that point. The market here moves in a sideways direction. The Aroon also helps to spot this type of market.
During this market movement, it may not be a clear sideways movement but there is always no crossing taking place in the Aroon indicator as any crossing recorded or seen can result in trend reversal or change in trend but the sideways movement without crossing indicates a consolidation of the market.
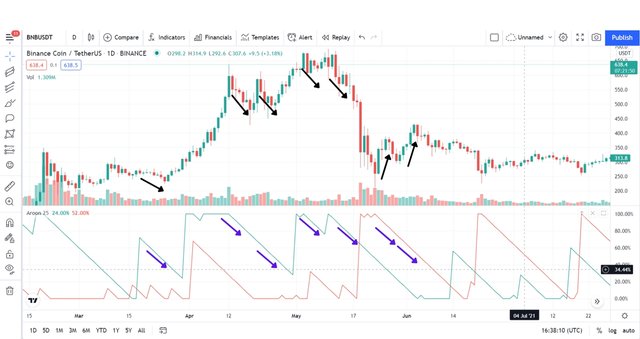
Looking carefully at the image above, you will notice the points marked with black arrows which indicate consolidation in both the uptrend and downtrend movement of the market. The purple line on the other hand marks the sideways or parallel movement of the asset.
| State the Merits and Demerits of the Aroon Indicator |
|---|
As we all know, everything that has an advantage also has a disadvantage. The case of the Aroon indicator is not different. Below are some advantages and disadvantages of the indicator.
Advantages
i.) it is used to determine the strength of a trend
ii.) Can be used in any type of trend in the market i.e. uptrend, downtrend, and sideways.
iii.) Easy to use and its calculation is simple.
Disadvantages
i.) Presence of a false signal means it is not reliable
ii.) Must always be used alongside another indicator to maximize profits
iii.) Traders don't maximize profit because of late signal
This will be the last part of the Aroon indicator hence if you have any questions or contributions please do well to drop a comment in the comment section of any of the posts be it part 1, part 2, or even this current post I have made. I will hurriedly attend to it. I hope this has educated us well about the wonderful tool called the Aroon indicator.
Note: All screenshots are taken by me from the Trading View website
https://twitter.com/xavierf14044615/status/1660983588358062082?s=20
Thank you for your contribution to the community. Keep on sharing quality original posts and please read our how-to posts which have been pinned in the community.
Nice review, we hope you can maintain a professional quality post if you want to share relevant topics in the Steem Alliance community.
Increase your Engagement in the community to exchange ideas and interact with teams from various communities.
Please always review the posts we have pinned on the community page. There are many guides that you should know, and they will be very useful.
Rating : 9/10
have a nice day!
Thanks