Trading with Twin Range Filter Indicator

Background Image Edited on Canvas
Greetings dear friends and welcome to my blog once again. Day in and day out we seek a better way that trade the financial market will become easy and profitable to traders all over the world.
You can't continue losing money to the financial market and for that reason, you need to embrace a more effective way to minimize your losses and maximize your profits.
In this article today, I will be sharing yet another powerful tool that is very easy to use and it has proven effective over time. We all know that indicators are not to be used as a stand-alone tool to make a decision but most times they give us the first-hand information needed.
Twin Range Filter Indicator
This is one of the indicators used today by most profitable traders in the financial market. The reason I have come to share it with you all today is that this tool is simple and easy to use.
Even if you are new to trading, all you need is to know the two basic terminologies used in trading I.e long and short which means buy and sell respectively.
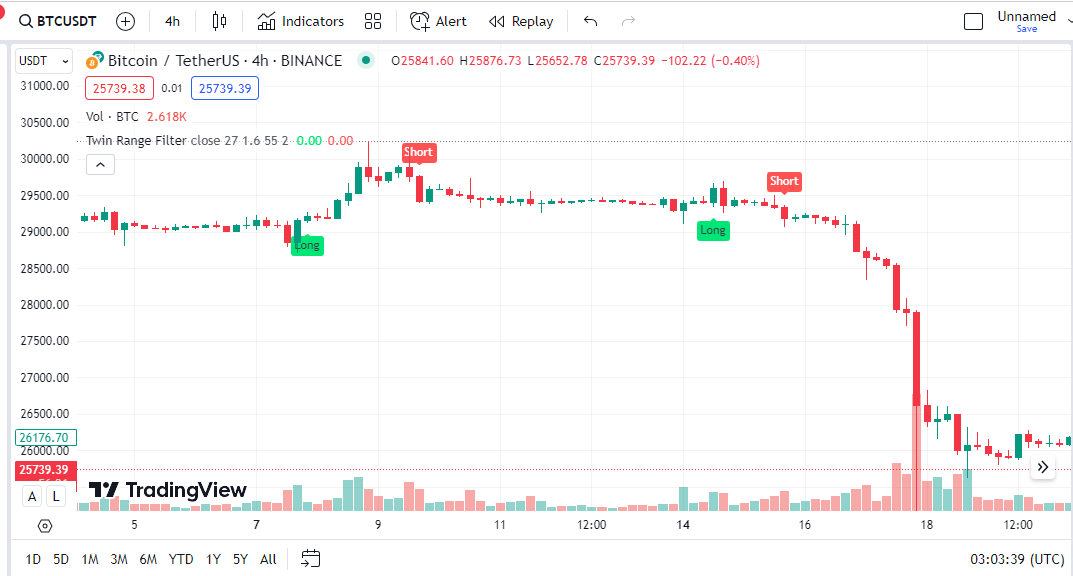
The indicator uses these two terminologies to tell traders when to buy the market and when to sell the market. Not many indicators will give you information as to when you should long the market or short it.
The Twin Range Filter Indicator uses the long which is shaded with green indicating a buy or an uptrend movement and the short which is shaded with red indicating a sell or a downtrend movement in the market.
When the long signal shows up on the chart, you will have to wait for the closure of the candle which the long is underneath it before entering the market or you can enter immediately to maximize all profits your stop loss should be placed immediately at the beginning of the first bullish candle before the one that has the signal.
In the same way, when the short signal shows on a chart, you will have to wait for the closure of the candle which the short signal is above it and then enter the trade once the next candle starts forming or you can enter immediately to maximize all profits and your stop loss should be placed immediately at the beginning of the first bearish candle before the one that gave the signal.
How to add the Twin Range Filter Indicator to a chart
As usual, adding an indicator to a chart is done in the same manner but I will be showing us the procedure for the benefit of those who are reading my post for the first time and also those who are new to the Trading View website.
Step 1: Visit the tradingview.com website because that is where most traders carry out their analysis.
Step 2: Select any crypto pair of your choice. Here we will be using the BTCUSDT pair on a 4H timeframe as seen in the screenshot below.

Step 3: Click on the indicator at the top menu and then search for the Twin Range Filter in the search bar as seen in the screenshot below and click on it to add

Step 4: Check the chart to see if it has been added as seen in the screenshot below.
Step 5: Click on the settings button on the indicator and then go to inputs, You will see the default settings on the input don't change it. See the screenshot below.

Step 6: Click on the settings button on the indicator and then go to styles, You will see the default settings on the styles don't change it. See the screenshot below.

Trading the Bullish trend using the Twin Range Indicator
I did my analysis of the BTCUSDT pair on a 4H timeframe then I went ahead to enter the trade using the 30M timeframe. The analysis is usually done on a large timeframe and the entry is done using a smaller timeframe.

From the above chart, you will notice that the chart is on a 30M timeframe. The entry position normally comes after the formation of a bullish candle which gives momentum to the next candle where the buy signal will be located underneath.
From the chart, you will notice a sharp entry immediately after the buy signal shows itself because I don't want to miss out on any opportunities. I have already done other technical analyses and used other confluence to confirm the trade. I will also advise you to use other strategies like the one I taught earlier in combination with the indicator.
The stop loss is seen below the first bullish candle which formed the momentum that gave rise to the next where our signal came. The screenshot shows it clearly.
As a trader, always minimize your risk. The risk-reward ratio for that trade is about 1:50 which is a very good profit for every trader out there.
Trading the Bearish trend using the Twin Range Indicator
I did my analysis of the BTCUSDT pair on a 4H timeframe then I went ahead to enter the trade using the 30M timeframe. The analysis is usually done on a large timeframe and the entry is done using a smaller timeframe.

From the above chart, you will notice that the chart is on a 30M timeframe. The entry position normally comes after the formation of a bearish candle which gives momentum to the next candle where the sell signal will be located above.
From the chart, you will notice a sharp entry immediately after the sell signal shows itself because I don't want to miss out on any opportunities. I have already done other technical analyses and used other confluence to confirm the trade.
The stop loss is seen above the first bearish candle which formed the momentum that gave rise to the next where our signal came. The screenshot shows it clearly.
As a trader, always minimize your risk. The risk-reward ratio for that trade is about 0.5:50 which is a very good profit for every trader out there.
Conclusion
The Twin Range Filter indicator is an indicator that gives us a clear signal of when to long or short the market. The signal always comes after the first bullish or bearish candle. The stop loss is usually below the first bullish or bearish candle before the entry position.
Always analyze the market with a higher timeframe if you wish to stay longer in the market and then enter the market with a smaller timeframe. If you have any questions or contributions please use the comment section of this post for that. Thanks for your time on my blog today.
Disclaimer: This post is made as an education and not investment advice. Digital asset prices are subject to change. All forms of crypto investment have a high risk. I am not a financial advisor, before jumping to any conclusions in this matter please do your research and consult a financial advisor.
NB: All images except otherwise stated are mine and taken from tradingview.com website
X-share
Dear @simonnwigwe ,
We appreciate your active participation and contributions to our community. To ensure a positive environment for all members, we have implemented a set of guidelines to maintain respectful and constructive discussions while upholding community guidelines.
This is a nice post but can this indicator be used as a stand alone technical tool?
Now Engage, Connect, and Inspire Each Other to Reach New heights.
Thank You.
Thanks for the review. For your question, i stated the answer earlier on the post.
So the indicator should not be used as a stand alone tool to make decision.