Trading with Purple cloud + Smoothed Moving Average + EMA Difference Histogram and Stochastic Indicators
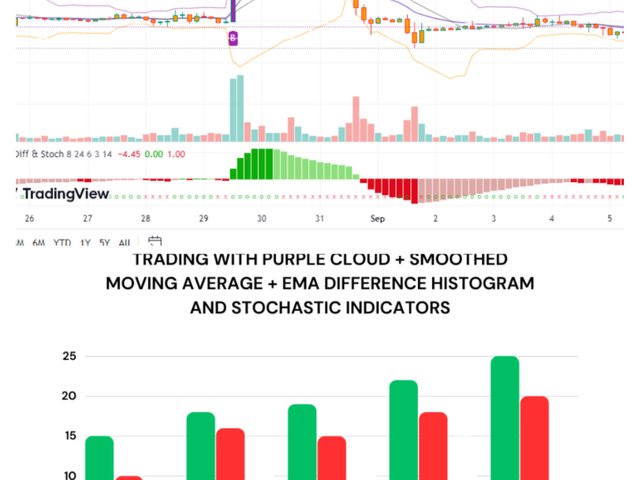
Background Image Edited on Canvas
Hello Steemians, It is a great day to share with you all another interesting package, I hope you will find this piece of work educative enough. Without much time wasting, let's go straight into the work of the day.
The topic today says Trading with Purple Cloud + Smoothed Moving Average + EMA Difference Histogram and Stochastic Indicators. This means the combination of the three indicators on a single chart to obtain a more reliable result.
Before I progress, I would like to make a recap of the various indicators one after the other. This will enable us to have our memory refresher for those who have gone through my previous lecture or post. To those who haven't gone through it, you will also have an idea of what the indicators are.
The purple cloud indicator is one of the most effective indicators that tells traders when to buy or sell the market using its B & S symbols which represent the buying and selling of an asset at any point and time. If you need more insight about this indicator, please read through the main post on my blog.
EMA Difference Histogram and Stochastic Indicator is another important indicator that is made of a range of numbers with 0 as its middle number. This indicator uses a histogram to represent the buying and the selling signals. Buying here is represented with an upward histogram usually green in colour and the selling is usually represented with a downward red histogram.
A smoothed Moving Average Indicator indicator is an indicator that gives the trader an idea of the trend of the market and also when to enter a long or a short depending on the crossing of the moving average line below or above the price action chart.
Adding the indicators to a chart
To add the Indicator to a chart all you need is to follow the simple procedure highlighted below. It is the same as the one I have always presented in my previous post and I guess you should be familiar with it now.
Step 1: Go to tradingview.com website or click the address to take you there.
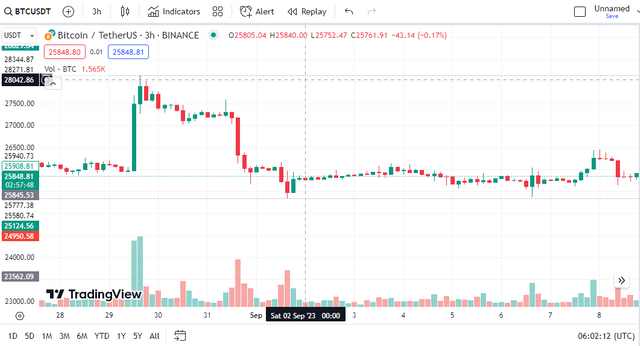
Step 2: Select a crypto pair of your choice in my case I selected BTCUSDT on a 3H timeframe as seen in the screenshot below.
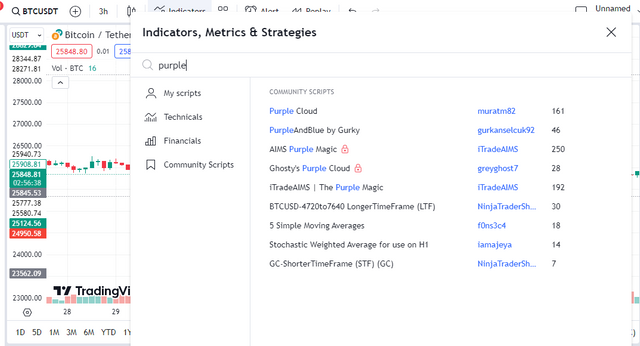
Step 3: Click on the indicator menu at the top part of the chart and then on the search bar, look for Purple cloud and add, Smoothed Moving Average and add and lastly EMA Difference Histogram and Stochastic Indicators and add as seen in the screenshot below.
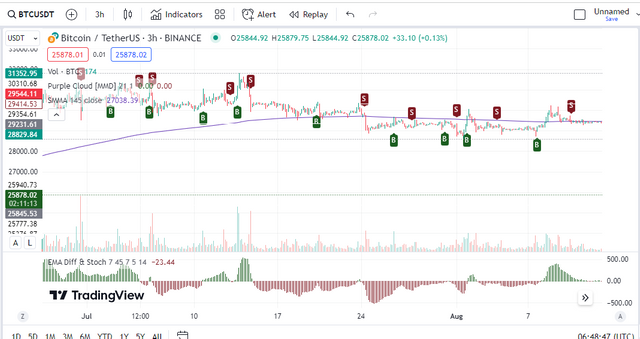
Step 4: Check to be sure that the Purple Cloud + Smoothed Moving Average + EMA Difference Histogram and Stochastic Indicators have been added to your chart as seen in the screenshot below.
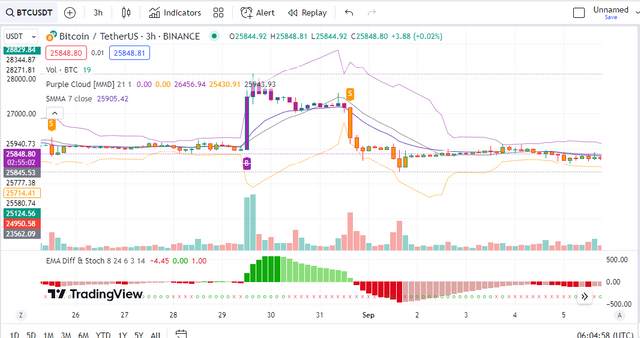
Step 5: Click on settings and then on adjust all the settings I taught us in the previous class and then add it to all the indicators as seen in the screenshot below.
Trading the uptrend market using the Purple cloud + Smoothed Moving Average + EMA Difference Histogram and Stochastic Indicators
In trading the bullish or uptrend market using the Purple cloud + Smoothed Moving Average + EMA Difference Histogram and Stochastic Indicators, you have to have all of the indicators agreeing with each other to dictate that the signal is not a false one.
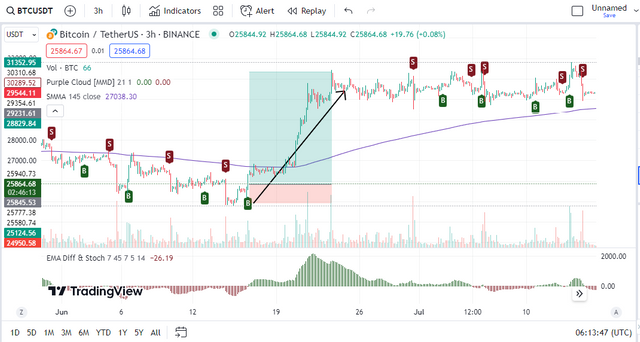
From the chart of BTCUSDT on the 3H timeframe above, you will notice all three indicators agreeing before we took the buying. The purple cloud ☁️ gave us a buy signal B, the smoothed moving average crossed the price action and started trending below the price action, and the EMA Difference Histogram and Stochastic Indicator were seen above the 0 range and were greenish.
Things to consider before longing the market
B signal from the purple indicator must be seen below the candle. Wait for the closure of the first candle after the B signal to enter the trade.
Smoothed MA line must be below the price action as a confirmation. This comes late a times.
EMA difference Histogram and Stochastic Indicator must be green and trending above the 0 range.
Trading the downtrend market using the Purple cloud + Smoothed Moving Average + EMA Difference Histogram and Stochastic Indicators
In the same way, when trading the bearish or downtrend market using the Purple cloud + Smoothed Moving Average + EMA Difference Histogram and Stochastic Indicators, you have to have all of the indicators agreeing with each other to dictate that the signal is not a false one.
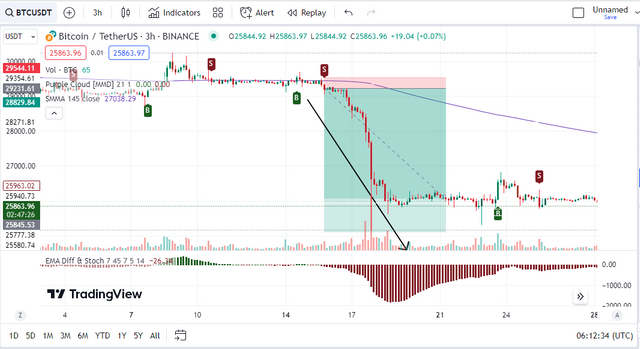
From the chart of BTCUSDT on the 3H timeframe above, you will notice all three indicators agreeing before we took the selling position. The purple cloud ☁️ gave us a sell signal S, the smoothed moving average crossed the price action and started trending above the price action, and the EMA Difference Histogram and Stochastic Indicator were seen below the 0 range and were reddish.
Things to consider before longing the market
S signal from the purple indicator must be seen above the candle. Wait for the closure of the first candle after the S signal to enter the trade.
Smoothed MA line must be above the price action as a confirmation. This comes late a times.
EMA difference Histogram and Stochastic Indicator must be red and trending below the 0 range.
Conclusion
You will agree with me that a more effective or efficient result has been achieved when combining the 3 indicators on a chart. When you have the three indicators, they all have to agree with each other before you can take a position.
If the three indicators are not in agreement, then there are possibilities that a false signal may show up and it is advisable not to trade that setup. I hope you find this article interesting enough.
If you have any questions, contributions or observations, please down well to use the comment section of this post and I will surely attend to them. Until then, we will meet again in my next publication.
Disclaimer: This post is made as an education and not investment advice. Digital asset prices are subject to change. All forms of crypto investment have a high risk. I am not a financial advisor, before jumping to any conclusions in this matter please do your research and consult a financial advisor.
NB: All images except otherwise stated are mine and taken from tradingview.com website
X-share
Dear @simonnwigwe ,
We appreciate your active participation and contributions to our community. To ensure a positive environment for all members, we have implemented a set of guidelines to maintain respectful and constructive discussions while upholding community guidelines.
This is interesting post on how we can find confluence when trading the cryptomarket.
Keep sharing Interesting contents in the community
Now Engage, Connect, and Inspire Each Other to Reach New heights.
Thank You.