MATICUSDT Analysis and a Demo Trade to check the efficiency of the analysis
Background Image Edited on Canvas
Over the past few days, all I have been doing is checking how effective my strategy is and I have continued to work daily to ensure that I improve on the spotted deficiency on the strategy. Practice indeed causes improvement and I'm delighted to continue practising as it helps me a lot to improve more.
Dear friends, it's another day to learn and I will be sharing with you my strategy as usual. If you have been following my tutorial, you will have noticed that my strategy is simple and anyone out there can use it. I'm not saying it's 100% effective but it at least gives you the basic knowledge you need with constant practice it will become part of you.
As you all know, my analysis is solely based on the support and resistance strategy and the reason for this is not far-fetched. Every crypto trader knows the importance of the support and resistance level and that is the main reason I use it as the basis for my analysis.
Today, we are going to be looking at the MATICUSDT pair using the same support and resistance strategy and then we can conclude based on the market if we are to buy or sell the market.
Every trade must know when to buy or sell the market. This analysis today will educate us on when we must buy or sell the market. When the price is above the support level and it's moving in an upward direction, you are to buy the market. In the same way, when the price is below the resistance level and it's moving downward, you are to sell the market.
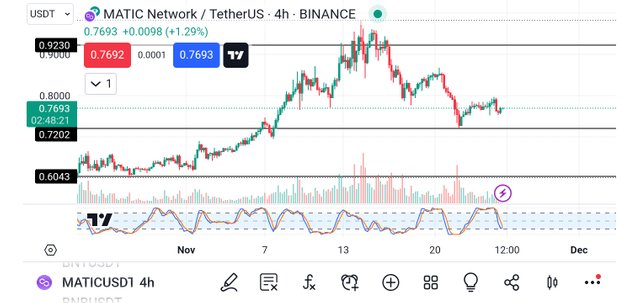
Now let's consider the chart above. From the above chart, you will notice that the price of MATIC is above the support level and is moving in an upward direction which simply implies that we are to buy the market.
Looking at the price carefully, you will notice that it was after a retest since we didn't join the market at the first move, we can join in this second move. So the retest has already produced one bullish candle as you can see above and the next candle is forming already which is a perfect time to enter the market. Recall that the time used for this analysis is 4H.
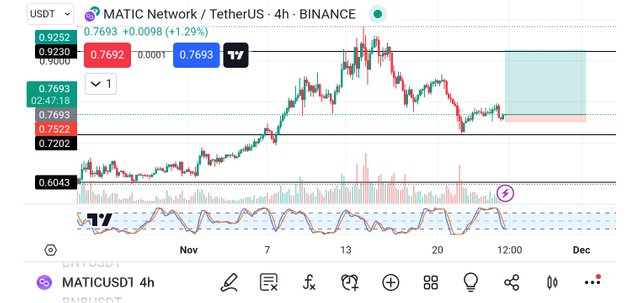
Seeing the confirmation of the movement of the market, I decided to introduce my buy logo signal as you can see in the screenshot above. From the logo, you can see that I placed a take-profit level at the next resistance level and the stop loss is just below the bullish candle which is like a risk-reward ratio of 2:10
Having introduced the buy logo symbol as seen in the chart above, I decided to also enter my demo trade for the pair since my analysis proved that the market is likely to go in my direction. The screenshot below shows my entry into the market.
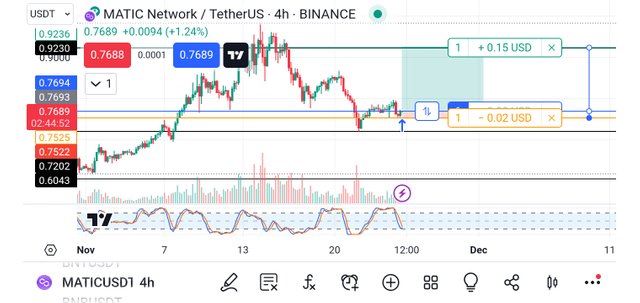
From the chart above, you will notice that if the market goes in my predicted direction, I will be making a profit of about 0.15 USD whereas if it goes against me I will be making a loss of 0.02 USD and that is how to make a proper risk management.
Finally, I took into consideration the position of the trade I opened as you can see from the screenshot below where the details of the trade are completely recorded. I do this so that you can see that I keep complete track of my trades.
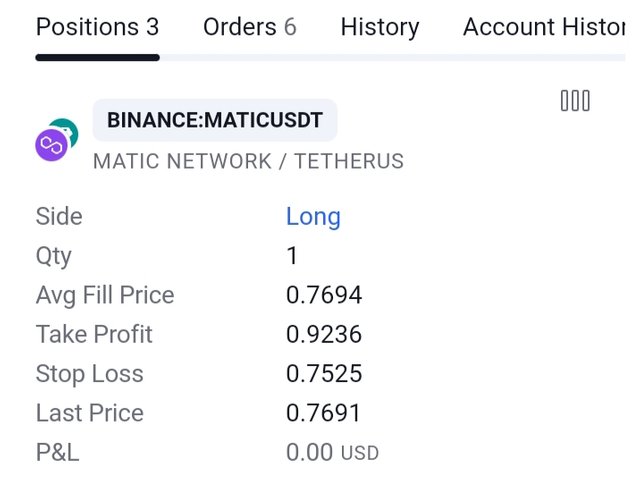
From the screenshot above, the side of the trade is long (buy), the quantity is 1 the average fill price is 0.7694 the take profit level for the order is 0.9236 and the stop loss level is 0.7525 and the P&L at the moment is 0.00 which means nothing has been added or removed as the trade just started.
Conclusion
The practice causes improvement. I will update the profits of this trade by sharing with us the screenshot of the profit as the market makes more moves. This is so we will know the outcome of the analysis we carried out.
Remember also that trading is like meditation, patience is the key. Always wait for the market to come to you and not for you to go to the market. Learn to identify your key support and resistance level and also trade with the trend and in that way, you will be a successful trader.
Finally, I want to thank you all for reading through my post today. If you have any questions or contributions, please do well to use the comment section of this post. See you all in my next publication.
Disclaimer: This post is made as an education and not investment advice. Digital asset prices are subject to change. All forms of crypto investment have a high risk. I am not a financial advisor, before jumping to any conclusions in this matter please do your research and consult a financial advisor.
NB: All images except otherwise stated are mine and taken from tradingview.com website
X-Share
Dear @simonnwigwe ,
We appreciate your active participation and contributions to our community. To ensure a positive environment for all members, we have implemented a set of guidelines to maintain respectful and constructive discussions while upholding community guidelines.
This is an interesting post on the demo trading analysis of maticusdt, keep sharing quality post in the community
Now Engage, Connect, and Inspire Each Other to Reach New heights.
Thank You.