Let's analyze BATUSDT using Top-Down Analysis and Demo trade it
Background Image Edited on Canvas
Greetings dear friends,
It's another day to learn and today we will be looking at the best ways which you are to use while analyzing a crypto asset before entering the market. I have discussed before now what the top-down analysis in crypto trading is all about but for the sake of those who are new and for a recap, I will still go through it so we can remember.
Top-down analysis as the name implies is an analysis format that deals with taking into consideration a higher timeframe analysis down to a lower timeframe. This means that if you are to carry out an analysis, you start from a higher timeframe of 1D downward, 1W downward or even 1M downward.
What matters here is that you consider the big picture by looking first at the higher timeframe before you can go back to the lower timeframe to make your trading decision. Now the reason why top-down analysis is important to traders is because it helps traders make better trading decisions.
A good example is if the market has a major resistance or support level in a higher timeframe of 1D, and the lower timeframe of 1H doesn't show such a level, it is your duty to know as a trader that the market will always respect that level and instead of jumping to the market and being kicked out, you will be patience to see if there will be a breakout in that level or the market will retest.
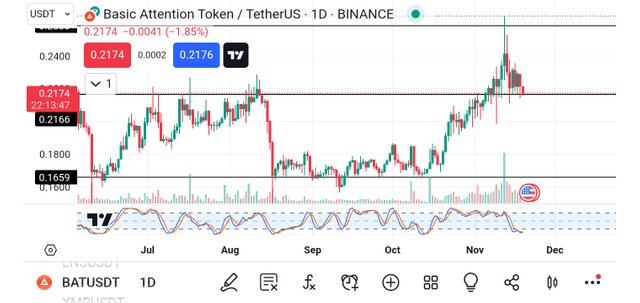
Now let's consider BATUSDT on a 1D timeframe as seen in the chart below. From the chart, I have taken into consideration a 1D chart and I have drawn out the various support and resistance levels of the market as you can see in the chart.
The market was rejected at the last resistance level and the moment it is struggling to break the current support level. So every good trader at this point will have to wait until a clear direction is given. In my case, since I want to take my entry on the 4H timeframe, I'm currently waiting for the closure of the candle.
While waiting, I also saw good possibilities that the market would break the support level when I went down to little timeframes like the 30M. With that in mind, I decided to introduce my sales logo to show how the market will play out and the possible gain one will make from the market goes as predicted.
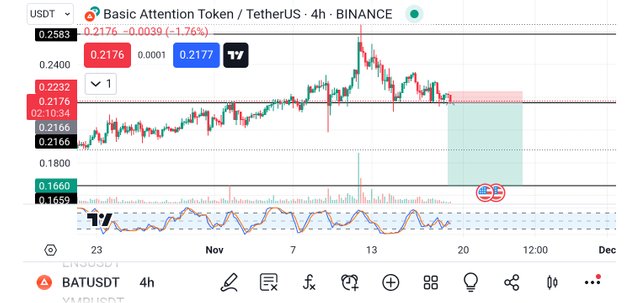
Based on that, I took my take profit to the next support level as seen in the chart above and the stop loss was just above the last bearish candle before the resistance line. With such risk management, one will be able to make a good profit from the trade.
Based on this analysis, you can conclude that the risk-reward ratio of the trade is around 2:10 which is a very good one if the market goes in my favour. I waited for the closure of the 4H candle because I needed to short the market. Remember trading is patience so you don't go to the market, you should always allow the market to come to you.
Immediately after the closure of the 4H candle, I took my demo trade of the asset as you can see from the screenshot below. I needed to see how far the market would play out so I took the trade.
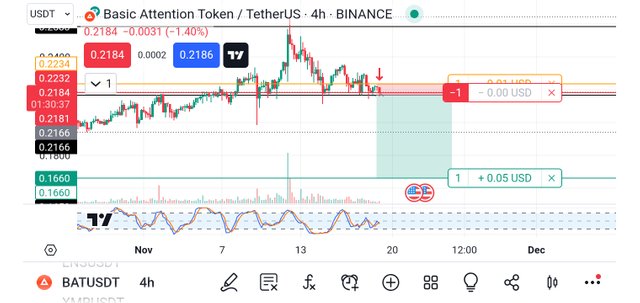
From the screenshot above, you will notice that the entry point is 0.2181, the take profit level is 0.1660 and the stop loss is 0.2234, which means that a profit of $0.05 will be made of the analysis goes as predicted and a loss of $0.01 if the analysis goes against me as sewn in the image above.
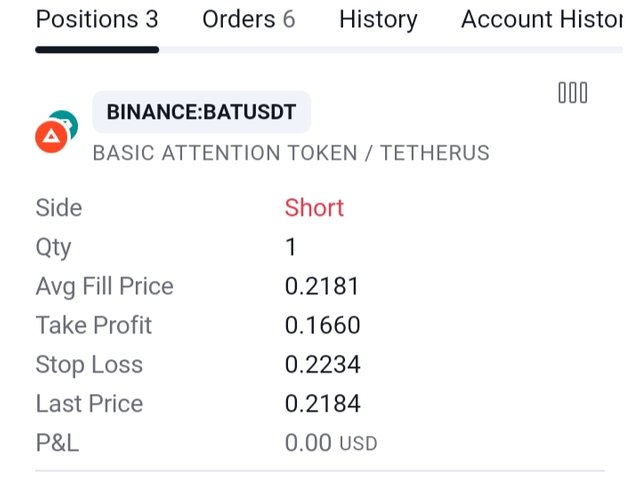
From the above image, you can see the position of the trade with all the details since I'm using paper trading. This is to keep track of the details of the transaction you took and that is the reason the direction of the trade the quantity and many more things are taken into consideration.
Now let's wait patiently and see how the market plays out. This will enable us to see if our analysis is right or wrong so that we can improve on it as well. I wish you all a happy trading day guys.
Conclusion
Top-down analysis is the best way to analyze any crypto pair as a crypto trader. With proper top-down analysis, you can spot key levels where the market will react and then take advantage of those levels to minimize loss and maximize profits.
Remember also that trading is like meditation, patience is the key. Always wait for the market to come to you and not for you to go to the market. Learn to identify your key support and resistance level and also trade with the trend and in that way, you will be a successful trader.
Finally, I want to thank you all for reading through my blog today. If you have any questions or contributions, please do well to use the comment section of this post. See you all in my next publication.
Disclaimer: This post is made as an education and not investment advice. Digital asset prices are subject to change. All forms of crypto investment have a high risk. I am not a financial advisor, before jumping to any conclusions in this matter please do your research and consult a financial advisor.
NB: All images except otherwise stated are mine and taken from tradingview.com website
X-Share
This is an interesting top down analysis that you have shared.
Keep sharing quality post in the community