DYDXUSDT Analysis and a Demo Trade to check the efficiency of the analysis
Background Image Edited on Canvas
Greetings my dear friends and welcome to my blog once again. It's another day of the week and as usual, we will continue practising our strategy in analyzing the crypto market until we become perfect in it or until we find a better strategy which gives more valuable results.
I want to believe that we all are ready for today's analysis of the market. I have said earlier that for you to become a better crypto analyst, you need to practice daily and also read books written by experts about this analysis.
With practice and more research or studies, you will notice an improvement at your end daily. So that is what I have been doing recently which has made me improve almost every day as I continue to step on.
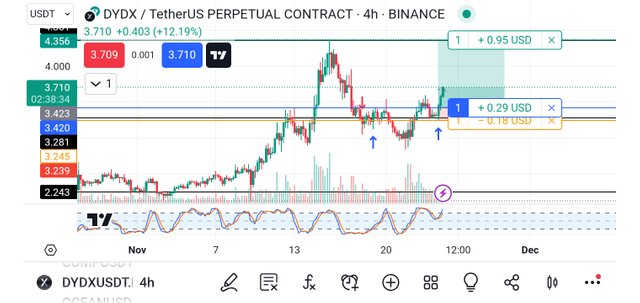
Today we are going to be looking at a pair called the DYDXUSDT pair. Here we are looking at the chart in a 4H timeframe and also analyzing it based on the aforementioned timeframe. This is to get a more reliable outcome. Now let's consider the chart below.
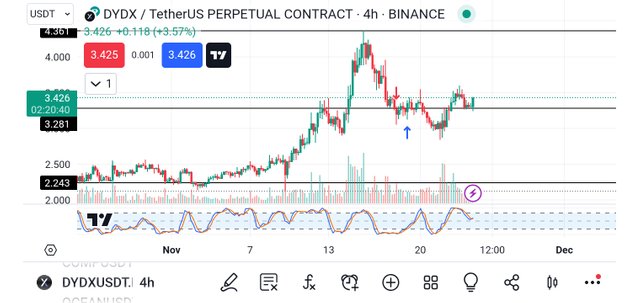
From the above chart, a few things were taken into consideration which led to the decision to take this very trade as a case study today and I will be highlighting a few of these things so that we too will consider them.
The first thing I checked was the resistance and the support level in the market during that period. I notice that the market in its 4H has a very strong bullish candle above the support level. Secondly, I saw that the Stochastic RSI indicator is still almost in the middle which means there are lots of tendencies that it will move to the overbought region.
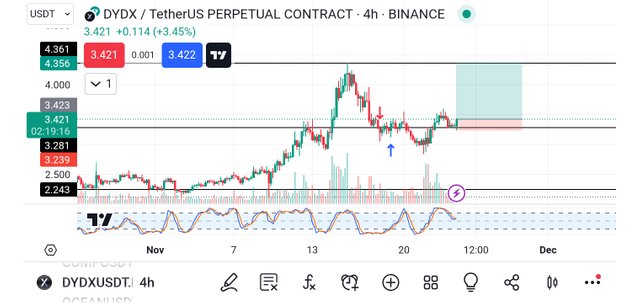
With all of this confirmation in place, I decided to introduce my buy logo as seen in the screenshot above. From the buy logo, my target profit is the next resistance level and that is why you see the logo right above the resistance a little bit. The stop loss also was below the bullish candle which was closing or has closed when using a smaller timeframe like 2H.
Seeing that the market has more potential to move in my predicted direction, I decided to introduce the buy demo trade as you can see in the screenshot below.
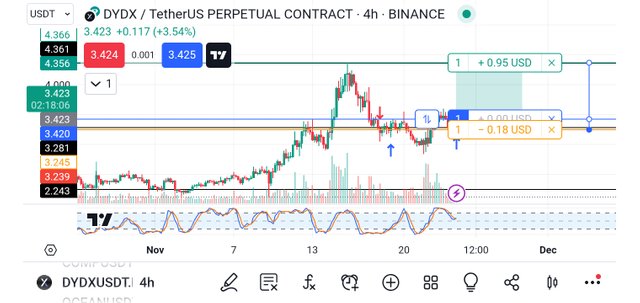
Based on the screenshots, the data it carries includes making a profit of 0.95 USD from the market going in the predicted direction and also a loss of 0.18 USD if the market finally goes against me. This means that the risk-reward ratio for this trade is around 1:5 which is a perfect risk-reward ratio which every trader will confidently go for.
To get more details about the said trade I decided to pick the screenshot of the demo position of the trade and as you can see from the image below a complete detail of the open position is recorded.
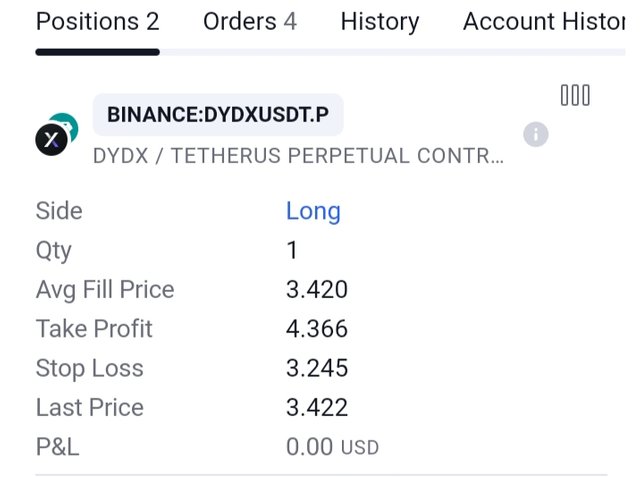
The image above shows the side of the trade which is long (buy), the quantity of the asset which is 1, and the average filled price which is the price I entered the market in this case my price is 3.420, the take profit level which is 4.366, the stop loss level is 3.245 and the last price of the asset is 3.422 as seen above. The PNL at the moment is 0.00
Profits made after some hours of opening the trade
Conclusion
The analysis above is a test run to check my strategy and how effective it is. I'm still holding on to the trade to see how the market goes. With time I will be able to have a better and more effective to analyse the market.
Remember also that trading is like meditation, patience is the key. Always wait for the market to come to you and not for you to go to the market. Learn to identify your key support and resistance level and also trade with the trend and in that way, you will be a successful trader.
Finally, I want to thank you all for reading through my blog today. If you have any questions or contributions, please do well to use the comment section of this post. See you all in my next publication.
Disclaimer: This post is made as an education and not investment advice. Digital asset prices are subject to change. All forms of crypto investment have a high risk. I am not a financial advisor, before jumping to any conclusions in this matter please do your research and consult a financial advisor.
NB: All images except otherwise stated are mine and taken from tradingview.com website
X-Share
Dear @simonnwigwe ,
We appreciate your active participation and contributions to our community. To ensure a positive environment for all members, we have implemented a set of guidelines to maintain respectful and constructive discussions while upholding community guidelines.
This is an interesting post you have shared in Community, keep sharing quality post
Now Engage, Connect, and Inspire Each Other to Reach New heights.
Thank You.