Crypto Trading With SuperTrend Indicator (Part 1)
To effectively maximize profit in trading, some indicators have been adopted to be used. As we all know, trading is supposed to be done in the direction of the trend but looking at the direction alone may not give us a complete guide as to where the market may be going there after and this is where the use of indicators comes into play.

Background Image Source
In today's episode, we will be looking at a very simple and popular indicator that is used by most traders all over the world. The joy is that the indicator can be used by all even newbies in the crypto trade because of how easy it is. Now let's get started with the SuperTrend Indicator.
SuperTrend Indicator and how it is calculated |
|---|
SuperTrend indicator as I have said earlier is a trend-based indicator that makes use of its color to notify traders of the trend of the market at any point in time. How does this work? It is quite simple how it works and I will be explaining it briefly below.
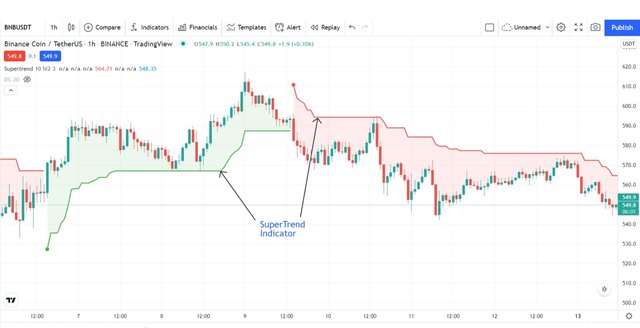
The SuperTrend indicator is made up of two colors i.e. red and green. In the case of an uptrend or bullish movement, the indicator turns green and is seen below the price action or chart acting as a support to the price. In the same way, for a downtrend or bearish movement, the indicator turns red and is seen above the price action or chart acting as resistance to the price.
The above happens when the market is trending i.e. uptrend or downtrend. In the case of sideways movement, the indicative is seen moving horizontally either above or below the price action or chart or candle sticks.
One indicator that acts almost the same as the SuperTrend indicator is the Moving Average. I said this because both indicators act as dynamic support and resistance to their price actions. The only notable difference is that there is no crossing in the SuperTrend as it is in the Moving Average when the trend tends to change.
From the image above, you can see that the SuperTrend indicator didn't cross instead it started a new in the opposite direction when the trend changed. You can also see that the indicator acted as dynamic support and resistance in the uptrend and downtrend respectively.
SuperTrend Calculation
To calculate the SuperTrend, you must make use of the Average True Range of a specific period. This is important because it helps to adjust the volatility that can be seen in the market since the market is never stable. You can apply the following formulas to calculate the uptrend and downtrend respectively.
UpTrend (Lower Line) = (High + Low) / 2 - Multiplier x ATR
DownTrend (Higher Line) = (High + Low) / 2 + Multiplier x ATR
From the above formula, you need to first get the ATR which is obtainable by calculating the True Range and the True Range can also be gotten from the following formulas below. Note that we have 3 formulas that must be used to calculate the True Range and the highest answer among the outcome of the 3 formulas become our True Range. The formulas are
- Current high - Current Low
- Absolute value (Current high - Previous Close)
- Absolute value (Current low - previous Close)
When this arithmetic is carried out, the highest value gotten from among these formulas is then added to the formula below
ATRn = [ATRn-1 x (n-1) + TRn] / n
So the above formula is what we will use to obtain the ATR which will then be substituted to either the uptrend or downtrend of the SuperTrend indicator formula to search for our result. A multiplier is also added to the average in a downtrend movement whereas it is subtracted in an uptrend.
Main parameters of the SuperTrend indicator and How to configure them |
|---|
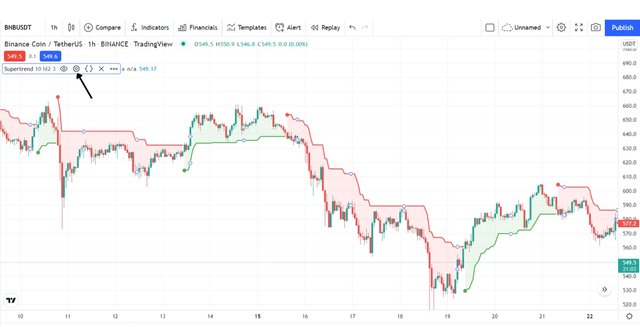
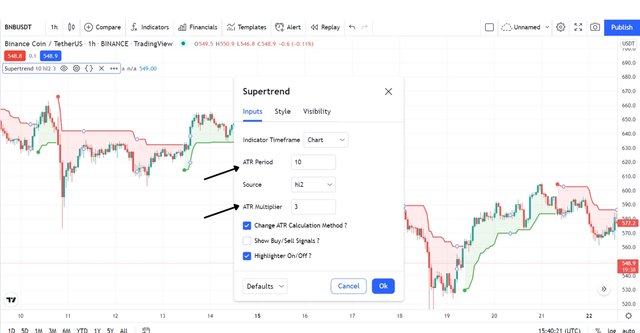
There are two main factors of SuperTrend and these are the ATR period and ATR multiplier. To have this configured, you must be sure to have added the indicator to your chart then click on the settings button on the indicator as seen in the image below.
In the input section as seen in the below screenshots, you can see the parameters we have earlier mentioned.
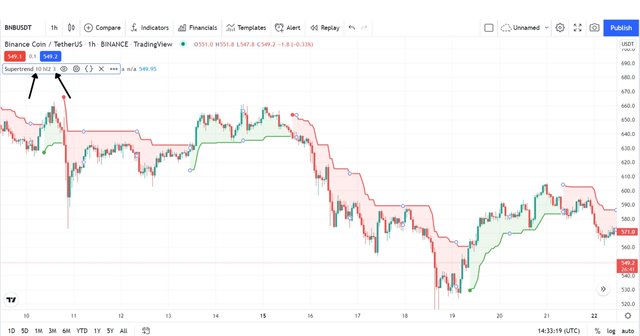
From the below image, you will notice the default values for the period and multiplier are 10 and 3 respectively.
ATR Period
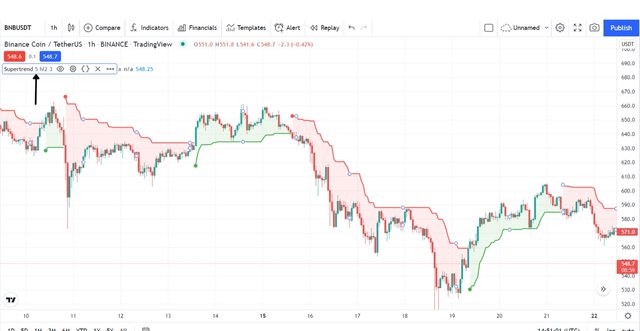
Working on the ATR period, I decided to change the default value which was initially 10 to 5 to see how the indicator will look. See the screenshot below.
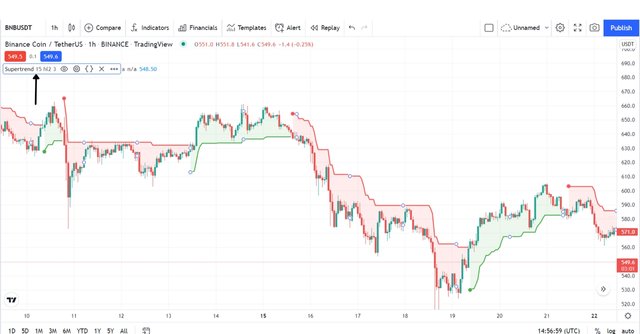
Secondly, I decided to change again the value of the ATR period to 15 and see what happens to the chart again. See the screenshot below.
After my changes from the default to 5 and 15 respectively, I observe that there are more early signals when making use of the higher periods. The screenshot above where I used 15 periods confirms my observation.
ATR Multiplier
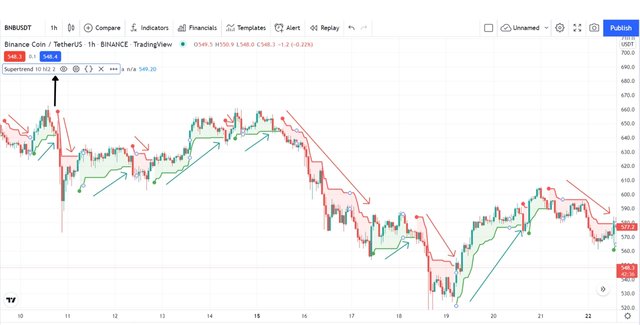
As we saw earlier, the ATR Multiplier has a default setting of 3. I decided to change the default from 3 to 2 and I discovered that the lower the ATR Multiplier the more sensitive it becomes. As it generates more signals. Based on this, I concluded that short-term traders will make better use of these settings but it can also generate false signals if we are not careful.
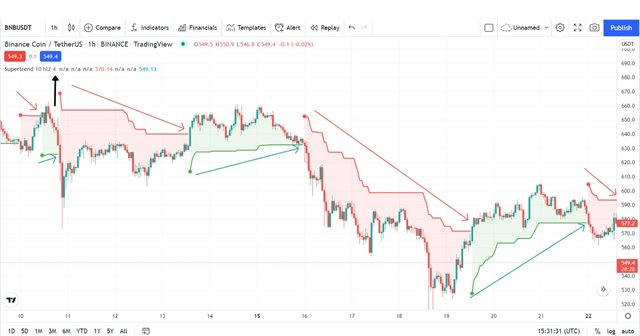
I decided to try a higher value for the ATR Multiplier and see the difference. I used the value 4 and I discover that this one is not as sensitive as the previous one as it generates less signal as you can see in the above image. With fewer signals as such, it won't be good for short-term traders but false signals may be taken care of better here.
After looking at the different settings, I can't completely say which is better than the other hence I recommend that individuals select a setting that they feel will be best for them. Better still, they can work with the default settings as it has taken care of most lapses that we may encounter by changing the settings
Conclusion |
|---|
I want to believe we have covered a lot of ground about the SuperTrend Indicator today. As I said early when I started the crypto chart analysis tutorial, I will not be putting too much in one place so that all those learning from it may take their time to digest and better understand the topic. So for that reason, I will be stopping part of this task here today and we will continue part 2 subsequently.
Note: All screenshots are mine taken from the TradingView website
https://twitter.com/xavierf14044615/status/1661663576405291010?s=20