Analyzing SOLUSDT using the head and shoulder pattern and demo trading it
Background Image Edited on Canvas
Hello guys,
It's another day to learn and I'm delighted once again to be your host. Every day we try to improve our knowledge of technical analysis and that is what makes us better traders. It's important to learn and unlearn most times to have all you will need to become a good market analyst.
With that in mind, you will need to read and research even more daily. Chart patterns as we all know repeat themselves often so the ability for you to see and recognize this pattern at all times makes you a more profitable trader in the market because through the pattern you can be able to properly predict the market direction.
This is the reason why some traders are more profitable than others. Trading is not gambling hence you have to study the market and its structure before entering the market. When you do that, you will not doubt your predictions and you won't be scared as well.
Today we are going to be looking at a very important pattern called the head and shoulder pattern. This pattern appears in some cases during our trading and when we see this pattern, we can easily predict the direction of the market via it.
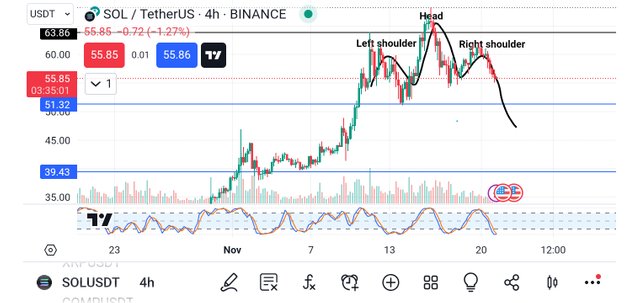
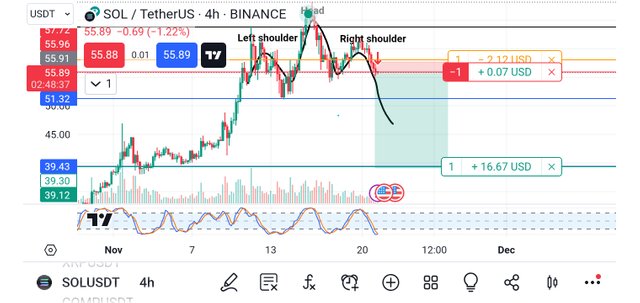
From the screenshot above, I have marked the points or areas where we have the left shoulder, the head and the right shoulder as you can see in the chart. You can also notice that the market is already in a downtrend format.
When you have a head and shoulder pattern formed, you are to expect a downtrend movement in the market and that is exactly what is happening at the moment. On the other hand, when you have an inverse head and shoulder pattern, you should expect an uptrend movement in the market.
So in this case, we are having a downtrend because it is a head and a shoulder. With the pattern confirmation, I do not doubt the direction of the market and for that reason, I had to introduce the sell logo symbol as you can see from the chart below.
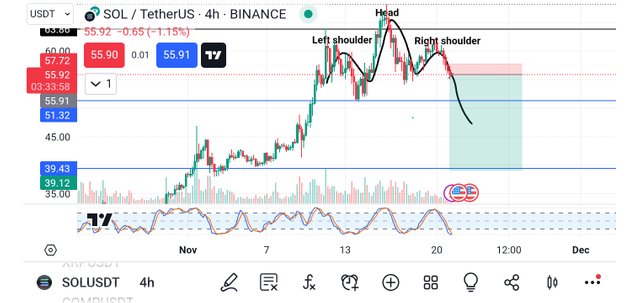
From the chart above, you will notice the logo placed on a 2:20 risk-reward ratio. This means that I'm expecting a very big dump from the said token because of the formation of the pattern I have noticed. Taking such a market doesn't require a waste of time for a particular candle to close in most cases because you already know the directions.
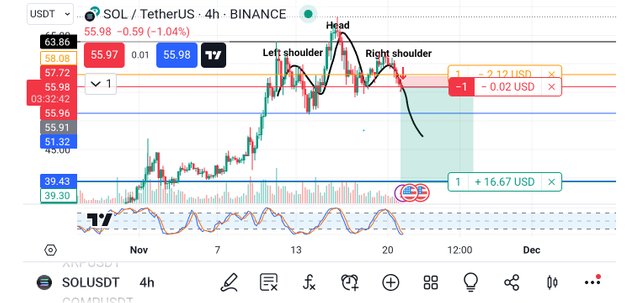
Since I was certain about the movement, I decided to enter the demo trade of the said pair of assets immediately. As you can see from the screenshot below, if the chart goes against me, I will lose 2.12 USD but if it goes in my favour I will gain 16.67 USD.
From the chart, you can see clearly that the demo trade has already kicked off and is already trading against me with a little loss. It's a normal trading format for the market to move against you before moving to your predicted directions so I'm not worried by that.
After a while, I checked the market again and as predicted, the market started moving in the direction I predicted. The screenshot above proves the effect as I have made some profit from the trade already.
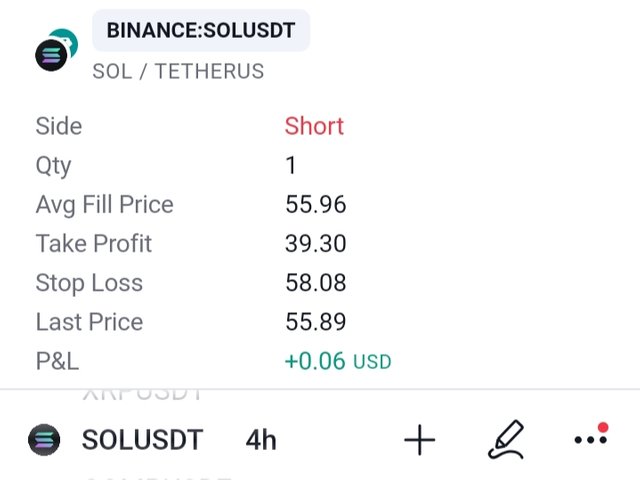
The position of the trade as recorded by the trading view paper trading which I use for the demo is also seen in the screenshot above. This is to help me keep track of the activities I do within the market at any point and time.
I want to believe we have to learn something new here today. Learning and understanding chart patterns is one of the biggest ways to win the market. You need not understand technical analysis, just understand the chart pattern.
Conclusion
The head and shoulder pattern is an ancient pattern which is used by most traders to this very day and it has proven to be more effective over time because it always repeats itself in the same manner. Today you all have seen how this pattern works effectively for me too as a trader.
Remember also that trading is like meditation, patience is the key. Always wait for the market to come to you and not for you to go to the market. Learn to identify your key support and resistance level and also trade with the trend and in that way, you will be a successful trader.
Finally, I want to thank you all for reading through my blog today. If you have any questions or contributions, please do well to use the comment section of this post. See you all in my next publication.
Disclaimer: This post is made as an education and not investment advice. Digital asset prices are subject to change. All forms of crypto investment have a high risk. I am not a financial advisor, before jumping to any conclusions in this matter please do your research and consult a financial advisor.
NB: All images except otherwise stated are mine and taken from tradingview.com website
X-Share
Dear @simonnwigwe ,
We appreciate your active participation and contributions to our community. To ensure a positive environment for all members, we have implemented a set of guidelines to maintain respectful and constructive discussions while upholding community guidelines.
This is a nice analysis from you, keep sharing quality post in the community
Now Engage, Connect, and Inspire Each Other to Reach New heights.
Thank You.