Analyzing and Demo Trading XRPUSDT using the Green Army strategy
Background Image Edited on Canvas
Hi everyone,
It's another day to learn and I remain your tutor in the person of @simonnwigwe from Nigeria 🇳🇬. I want to believe we are learning a lot from the technical analysis we have been working on here on my blog. Even if you don't have an idea of technical analysis, if you have been following my post, you will have the basic knowledge by this time.
Today we are going to use the Green Army strategy to enter a trade of the pair of XRPUSDT. One will ask why the Green Army? Well, as you can see from the screenshot below, my entire portfolio is green which means that buying at this point will be more profitable than selling.
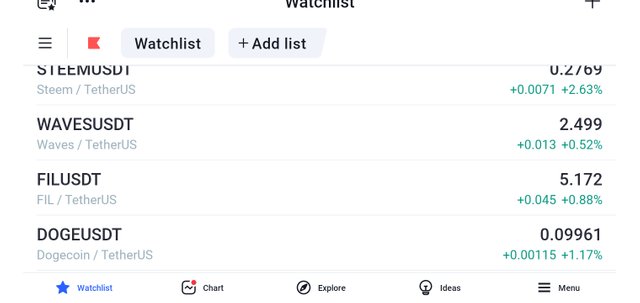
Since we are gradually approaching the bull run, it is best to place a buy order than to place a sell order. This means that the probability of a coin pumping up to 500% is possible that the coin to dump up to 60%. As a trader, always look for long positions during this time.
After carefully observing the market, I noticed that the market was in an uptrend then a little retracement was done, and then there was an impulsive movement about to take place as you can see from the screenshot below. I took advantage of that movement.
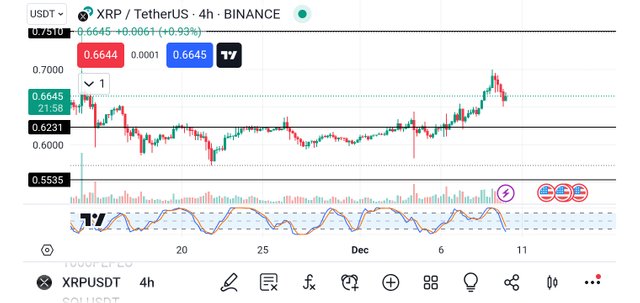
Based on the data of the above screenshot, you will agree with me that the asset is done with its retracement move and that is the reason for the formation of the bullish last candle. I was very certain that it would move upward hence I decided to long instead of shorting the market.
Seeing that the market has the potential to rise, I decided to introduce my buy logo as you can see from the screenshot below. I took very little risk from the image you can see with a very high profit i.e. if the market respects my analysis.
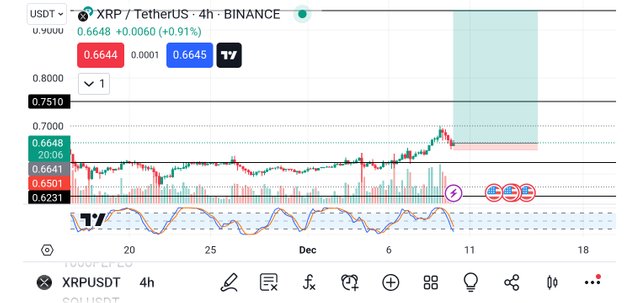
From the above image, I placed the buy logo already on the chart. I kept my stop-loss just below the last bearish candle and my take profit is seen at the second resistance level which will give about 2000% profit if the market goes in my favor.
After that, I decided to keep proper track by introducing the demo trade of the said pair as you can see from the screenshot below. This will help me to know if the analysis is going in my direction or against my direction.
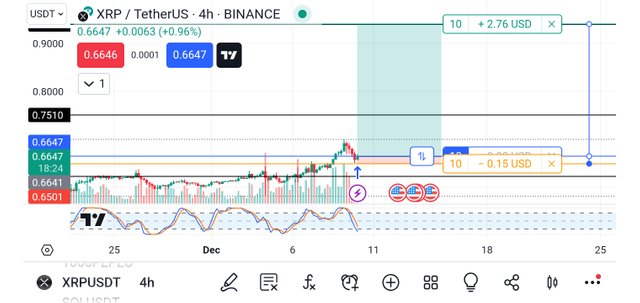
From the above screenshot, you will notice that if the market goes in my direction, I will be making 2.76 USD and if the market goes against me I will be losing 0.15 USD. This is a proper risk management and the trade is good to take hence the reason I took the trade.
Finally, I also took a screenshot of the position that I opened for the trade as it contains all the information you need to know about the trade I took. The screenshot below shows the open position.
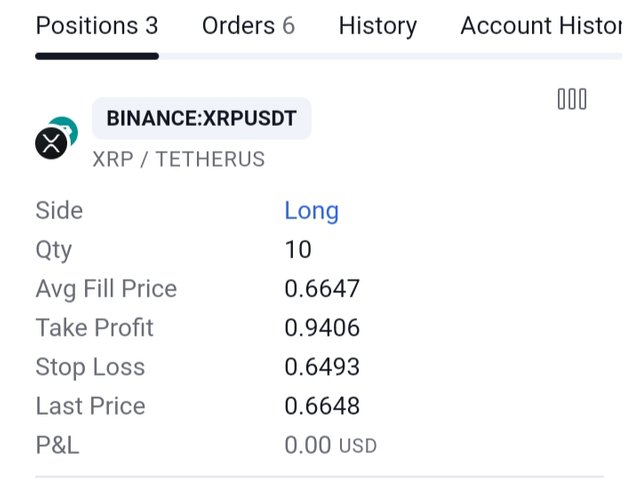
From the screenshot above, you will notice that the side is long (buy), the quantity is 10, the average fill price is 0.6647, the take profit level is at 0.9406, the stop loss is at 0.6493 and lastly the P&L at the moment is 0.00, that is all about the open order.
Conclusion
We are already in the first phase of the bull run hence I advise traders to take more of the long position than the short position and the reason is because the probability of coin pumping is higher than the probability of dumping. So take more longs in the market now. I wish you a happy trade during this bull run season.
Remember also that trading is like meditation, patience is the key. Always wait for the market to come to you and not for you to go to the market. Learn to identify your key support and resistance level and also trade with the trend and in that way, you will be a successful trader.
Finally, I want to thank you all for reading through my post today. If you have any questions or contributions, please do well to use the comment section of this post. See you all in my next publication.
Disclaimer: This post is made as an education and not investment advice. Digital asset prices are subject to change. All forms of crypto investment have a high risk. I am not a financial advisor, before jumping to any conclusions in this matter please do your research and consult a financial advisor.
NB: All images except otherwise stated are mine and taken from tradingview.com website
X-Share
Note:- ✅
Regards,
@theentertainer