Analyzing and Demo Trading SSVUSDT using support and resistance strategy
Background Image Edited on Canvas
Hello guys,
I welcome you all to my blog once again. I'm @simonnwigwe from Nigeria 🇳🇬 and I'm your crypto analyst. It is another brand new day and I'm delighted to share with you another technical analysis carried out by me on the pair of SSVUSDT on a 4H timeframe. Please read till the end to see what came out of the technical analysis today.
As you may all know, we are approaching the bull run, and for that reason, many coins have been moving very high recently. A lot of long positions are been opened nowadays because of the bullishness of the market. But the question remains, will the market continue moving in an upward direction without coming down?
I do not think so hence there is also room to shorten the market even though we are experiencing a bull run already. Based on this fact, I will want to show you all the analysis I made on the pair of SSVUSDT where I'm shorting the market.
The said analysis was done from a 1D timeframe where I took proper note of the resistance and the support level. Moving to the lower timeframe of 4H, I decided to see the market and then start introducing my different parameters.
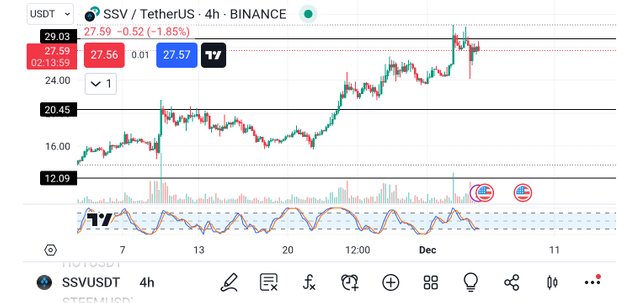
From the above image, you will notice that the market was rejected by the resistance level multiple times and for that reason, it shows the possibility of it moving bearish is much. With that in mind, I decided to closely look at the market and then tried to get possible entry and exit positions.
Looking at the below image, I have already introduced my sell logo which I used a proper risk management system of about 2:50. Since the rejection is at the resistance level, I decided to place my stop loss in that position and my take profit is seen at the second support level.
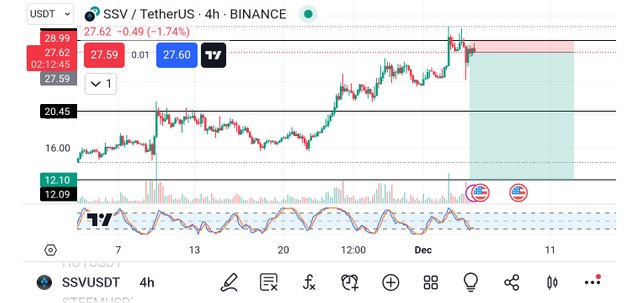
This implies that I have two take profit levels i.e. TP1 and TP2 respectively. With that in mind, I decided to also introduce the demo trade since I'm still working on my strategy and nothing should be left without proper testing.
In demo trading this pair of assets, I decided to take 10 quantities of it to earn a better or tangible something from the trade. As you can see from the below screenshot if the market goes in my favor, I will be earning a total of 154.98 USD but if the market goes against me, I will be losing 14.30 USD.
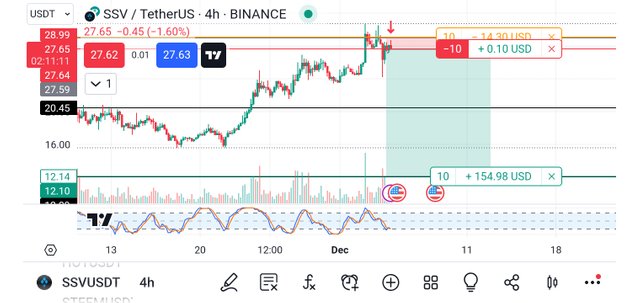
Based on that analysis, immediately I entered the market as you can see above, the market showed that it may respect my analysis very well as I have already made a profit of 0.10 USD. So I kept an eye on the market because anything could happen.
Finally, I also took a screenshot of the position that I opened for the trade as it contains all the information you need to know about the trade I took. The screenshot below shows the open position.
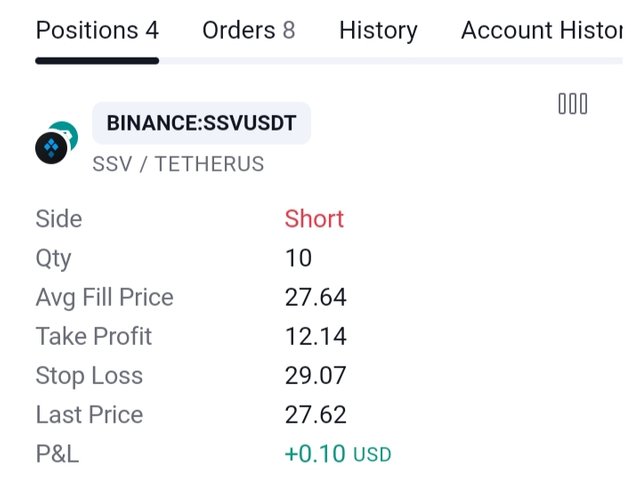
From the screenshot above, you will notice that the side is long (buy), the quantity is 10, the average fill price is 27.64, the take profit level is at 12.14, the stop loss is at 29.07 and lastly the P&L at the moment is 0.10, that is all about the open order.
Conclusion
Even though trades are bullish, you analyze the market and check with a higher timeframe a resistance level that the market respects before making your decision. If that level is broken, then the market will pump harder but if it doesn't then I expect the market to drop very well.
Remember also that trading is like meditation, patience is the key. Always wait for the market to come to you and not for you to go to the market. Learn to identify your key support and resistance level and also trade with the trend and in that way, you will be a successful trader.
Finally, I want to thank you all for reading through my post today. If you have any questions or contributions, please do well to use the comment section of this post. See you all in my next publication.
Disclaimer: This post is made as an education and not investment advice. Digital asset prices are subject to change. All forms of crypto investment have a high risk. I am not a financial advisor, before jumping to any conclusions in this matter please do your research and consult a financial advisor.
NB: All images except otherwise stated are mine and taken from tradingview.com website
X-Share
Dear @simonnwigwe ,
We appreciate your active participation and contributions to our community. To ensure a positive environment for all members, we have implemented a set of guidelines to maintain respectful and constructive discussions while upholding community guidelines.
Please I recommend that you give more details information on your trade and it's entry criteria
Now Engage, Connect, and Inspire Each Other to Reach New heights.
Thank You.