Analyzing and Demo Trading OPUSDT using the retracement and impulsive move strategy
Background Image Edited on Canvas
Seasonal greetings dear friends,
It's another day of the week and I'm delighted to share with you all a very important analysis on the pair of OPUSDT which I carried out recently using the retracement and impulsive move strategy.
I want first and foremost say a very big thank you to all those who have always supported this work in one way or another through their meaningful votes, comments, and many more. Your support has kept me moving higher. So keep encouraging me so that i too can do more.
Remember, I remain your favorite crypto analyst @simonnwigwe from Nigeria 🇳🇬. As promised, I won't be hiding any strategy from you all. I will share every tip that I used to trade the market with you all. Your success is my success and for that reason, I will share it with you all.
Without further ado, let's go straight to the business of the day. Analyzing the pair of OPUSDT using the retracement and impulsive move strategy is quite simple. You know that the market moves in a zig-zag manner hence you can easily say when it is going to go up or come down.
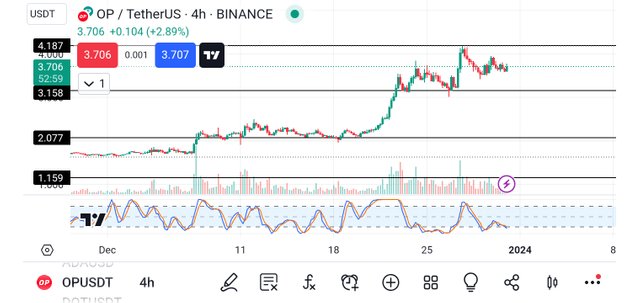
From the screenshot above, you will notice that the market has been in an uptrend direction. Seeing that, I concluded that the market may still move upward even though it was rejected by the resistance level.
From the chart, the rejection caused a retracement, which is a normal thing. The buyers at that point needed more momentum to go into the market. So after that retracement, we saw an impulsive move, and after that move, we saw a retracement and another impulsive move.
Seeing that, I concluded that the buyers are waxing stronger in the market and if they can push through and get to the resistance level again, they may break that level. So based on that assumption, I decided to introduce the buy logo symbol as you can see from the screenshot below.
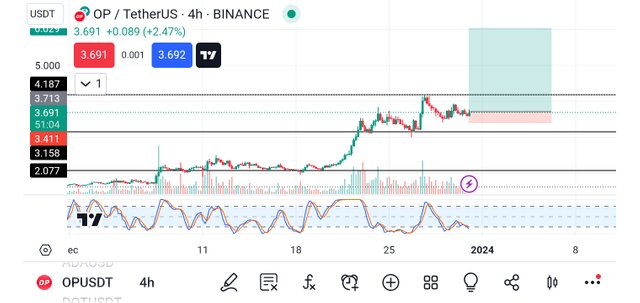
From the above screenshot, you will notice that the order has a very good risk-reward ratio. As you can see the stop loss in the market is placed below the last bearish candle in the first retracement. This is to keep us safe from losing much and also not being kicked out of the market on time.
The take profit as you have also seen is kept on the 3rd resistance level which means we can have TP1-TP3. If the market goes as predicted, the risk-to-reward ratio of the trade is around 2:10 which is a very good trade anyone will want to take.
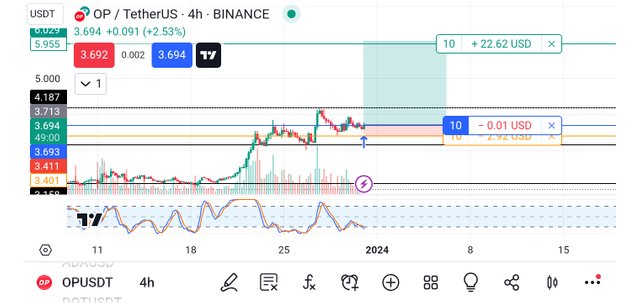
To properly analyze the market and to keep track of the entire market analysis, I decided to demo trade the market as you can see from the screenshot above.
Based on the screenshot, if the market goes in my favor, I will be making a profit of 22.62 USD and in the same way, if the market goes against me, I will be losing 2.92 USD which is a risk I'm willing to take in other to gain more if my prediction goes on in the right direction.
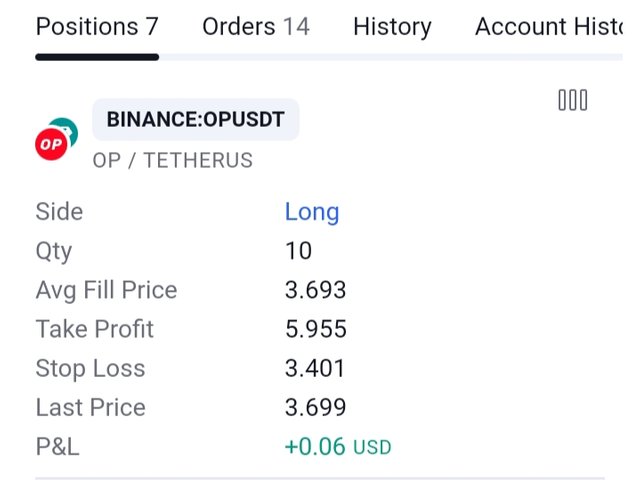
From the screenshot above, you will notice that the side is long (buy), the quantity is 10, the average fill price is 3.693, the take profit level is at 5.955, the stop loss is at 3.401 and lastly the P&L at the moment is +0.06, that is all about the open order.
From the below, I went back to the trade after 30M of initiating the demo to see how far the progress of the market is. I wanted to know if the market was respecting my analysis or if it was going against me.
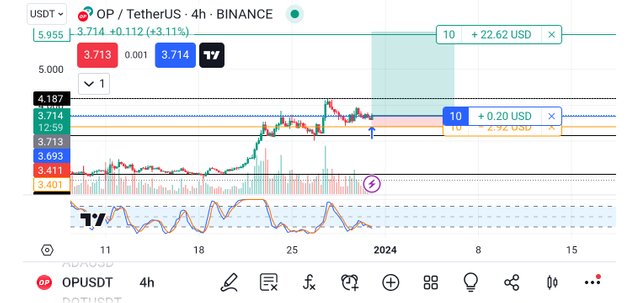
Based on the screenshot above you will agree with me that the analysis is already following our analysis very well. At the moment of making the post, the trade has already made a profit of about 0.20 USD which is a clear indication that we are on the right part. So we keep watch to see what we can get from the market.
Conclusion
Retracement and impulsive movement in the market are the best ways to get quick access to the market at any point and time. As you can see from the analysis, we took advantage of the retracement and impulsive move without waiting for the levels of resistance and support to be broken.
When you understand the market, you will size every opportunity that presents itself in the market and that will help you to minimize your losses and maximize your profit the best way you can. So that is all about this very pair.
Remember also that trading is like meditation, patience is the key. Always wait for the market to come to you and not for you to go to the market. Learn to identify your key support and resistance level and also trade with the trend and in that way, you will be a successful trader.
Finally, I want to thank you all for reading through my post today. If you have any questions or contributions, please do well to use the comment section of this post. See you all in my next publication.
Disclaimer: This post is made as an education and not investment advice. Digital asset prices are subject to change. All forms of crypto investment have a high risk. I am not a financial advisor, before jumping to any conclusions in this matter please do your research and consult a financial advisor.
NB: All images except otherwise stated are mine and taken from tradingview.com website
X-Share
Note:- ✅
Regards,
@theentertainer